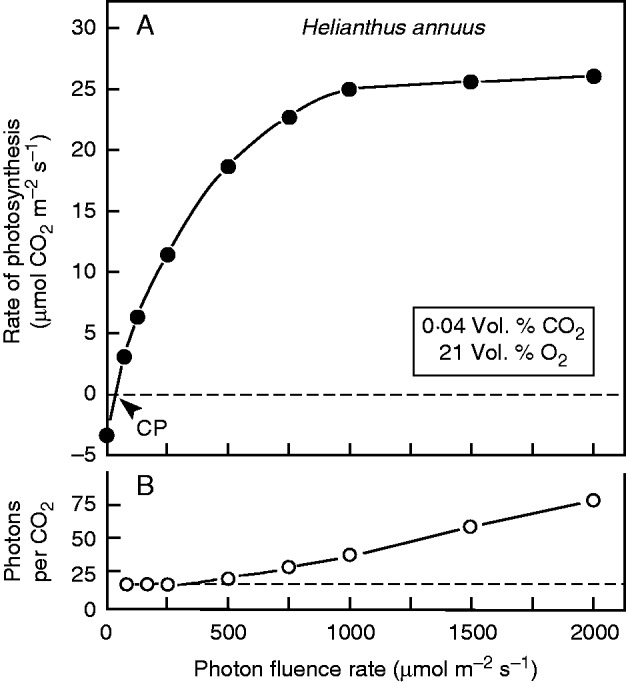
Fig. 4.

Representative light–response curve of net photosynthesis (CO2 assimilation) rate, measured on an upper, fully expanded leaf of a sunflower plant (see Fig. 1), as described by Kutschera et al. (2010). The light compensation point (CP) is indicated (approx. 40 μmol photons m–2 s–1) (A). The calculated ratio (photons per CO2 assimilated) indicates the growing inefficiency of photosynthesis with increasing irradiance (B).
