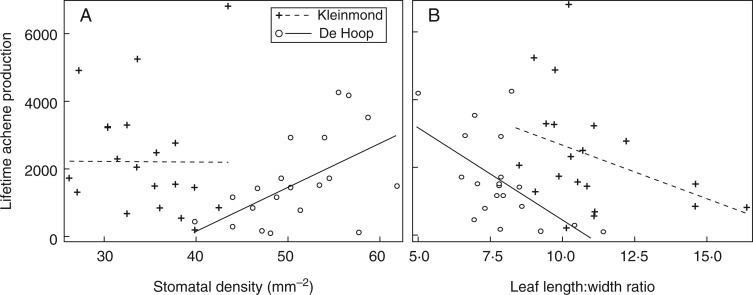
Fig. 4.
Stomatal density (A) and leaf length : width ratio (B) of adult Protea repens plants in De Hoop and Kleinmond reserves, in relation to the total number of achenes produced over the plant’s lifetime thus far (n = 20 per site). The single linear regression lines drawn here on raw data illustrate both significant (solid lines) and non-signficant (dotted lines) slopes from selection gradient analyses, i.e. mulitple regressions of all five standardized morphological traits, which also included SLA, SPI and leaf area. In these selection gradient analyses, stomatal density and leaf length : width ratio (LWR) were significantly correlated with achene production at De Hoop (P < 0·05), but no traits were significant at Kleinmond (not significant, P > 0·05; results in Table 1). When the two sites were compared in a single model for each trait, regression coefficients were significantly different between sites for stomatal density but not for LWR.

