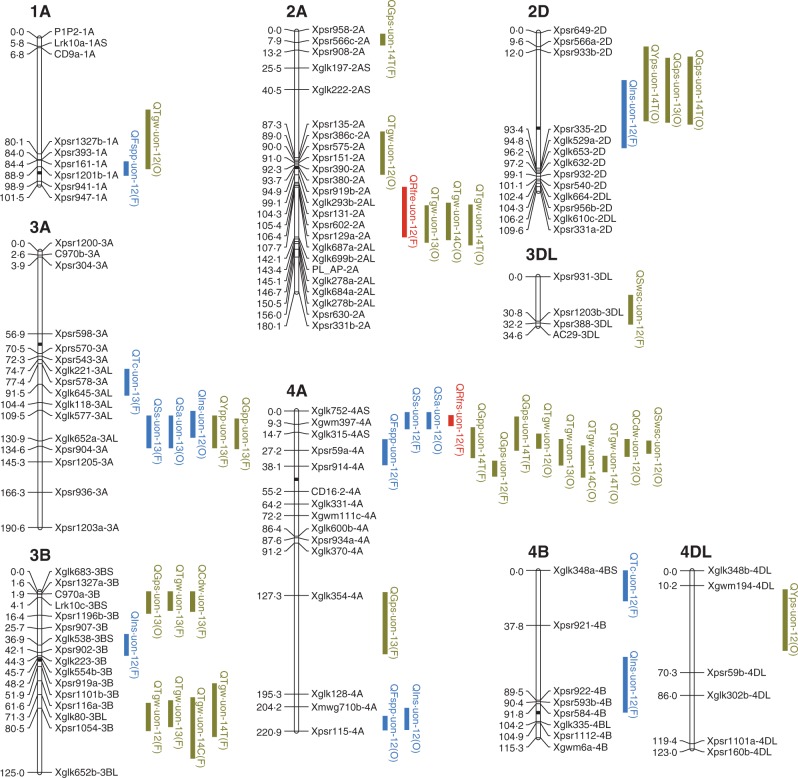
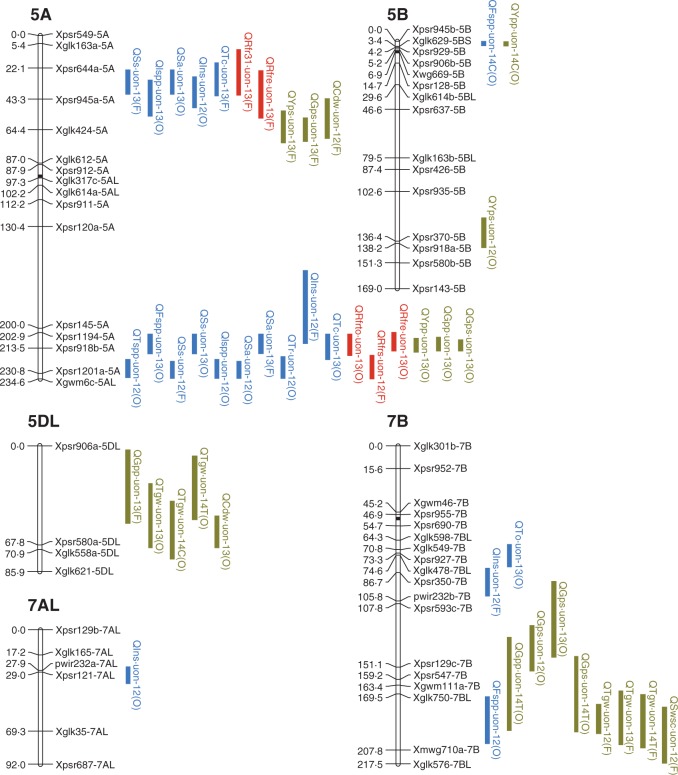
Fig. 3.
Quantitative trait loci (QTL) for tillering, red/far-red ratio (R:FR) and yield components in the mapping population of ‘Forno’ and ‘Oberkulmer’. The 1-LOD support intervals of significant QTL are indicated by blue (tillering), red (R:FR) and green (yield components) vertical bars. For QTL symbols, the ‘Q’ is followed by the abbreviated names of quantitative traits and laboratory (uon). Abbreviations for traits: Tspp, total shoots per plant; Fspp, fertile shoots per plant; Ss, shoot survival (%); Ispp, infertile shoots per plant; Sa, shoot abortion (%); Tr, tillering rate; Ins, initial shoots per plant; To, the time at tillering onset; Tc, the time at tillering cessation; Rfrto, R:FR at tillering onset; Rfr31, R:FR at GS31 (onset of stem elongation); Rfrs, stabilized R:FR; Rfre, the time at the end of R:FR reduction; Ypp, yield per plant; Yps, yield per shoot; Gpp, grains per plant; Gps, grains per shoot; Tgw, thousand grain weight; Cdw, carpel dry weight at anthesis; Swsc, stem water-soluble carbohydrate dry weight at anthesis. The QTL found in 2012 (field), 2013 (field), 2014 (glasshouse, control) and 2014 (glasshouse, shading treatment) are indicated by the suffixes 12, 13, 14C and 14T, respectively. The parental lines providing the alleles increasing trait values are given in parentheses: F, ‘Forno’; O, ‘Oberkulmer’.


