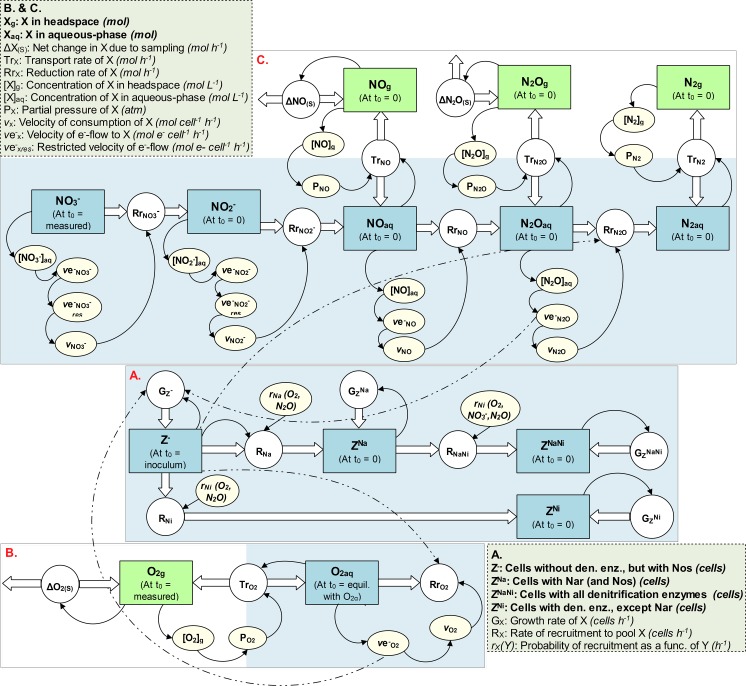
Fig 2. A stock and flow diagram illustrating the model’s structure.
A. Cell diversification and growth; B. O2 kinetics; C. Denitrification kinetics. The squares represent state variables, the circles the rate of change of the state variables, the edges (thicker arrows) depict flows into or out of the state variables, the shaded ovals auxiliary variables, and the arrows portray mutual dependencies between the variables. All feedback relationships among the three model sectors could not be shown; however, for illustration the feedback relationships of one sub-population (Z−) are shown (dashed arrows). Within each square (state variable), t0 refers to the initial value.

