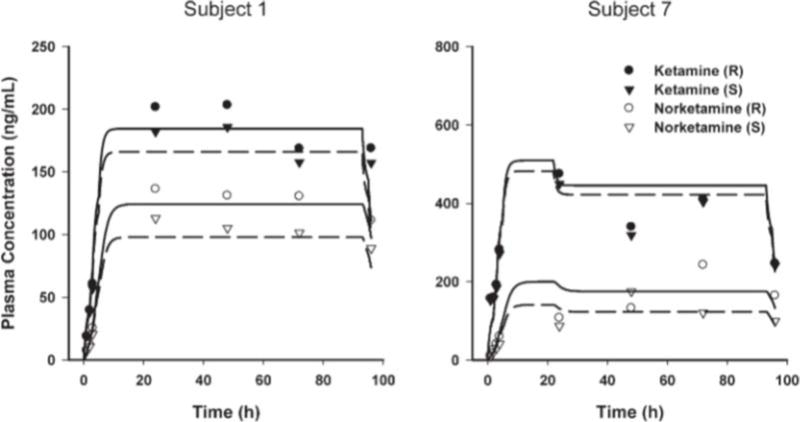
Fig. 2.

Time course of (R,S)-ketamine and (R,S)-norketamine plasma concentrations in two representative subjects. Symbols show measured concentrations. Lines are model-predicted profiles using individual pharmacokinetic parameters, where solid and dashed lines represent the R- and S-enantiomers, respectively.
