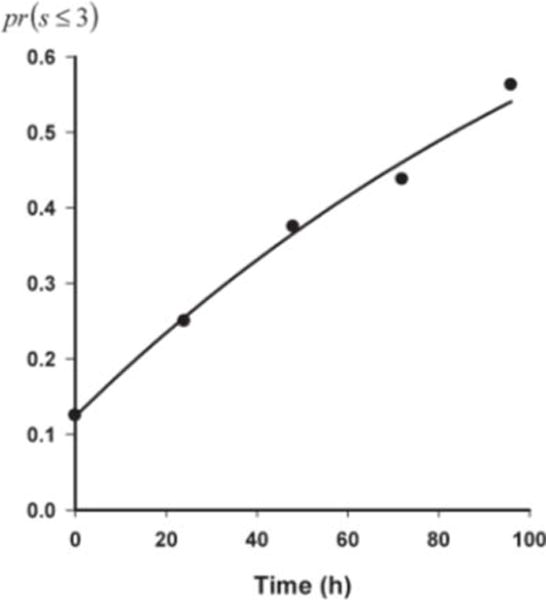
Fig. 4.

Temporal progression of the probability of achieving a pain score less than or equal to three over the duration of me study. Symbols represent calculated probability, and the line represents the model-fitted profile according to eq. 6.

Temporal progression of the probability of achieving a pain score less than or equal to three over the duration of me study. Symbols represent calculated probability, and the line represents the model-fitted profile according to eq. 6.