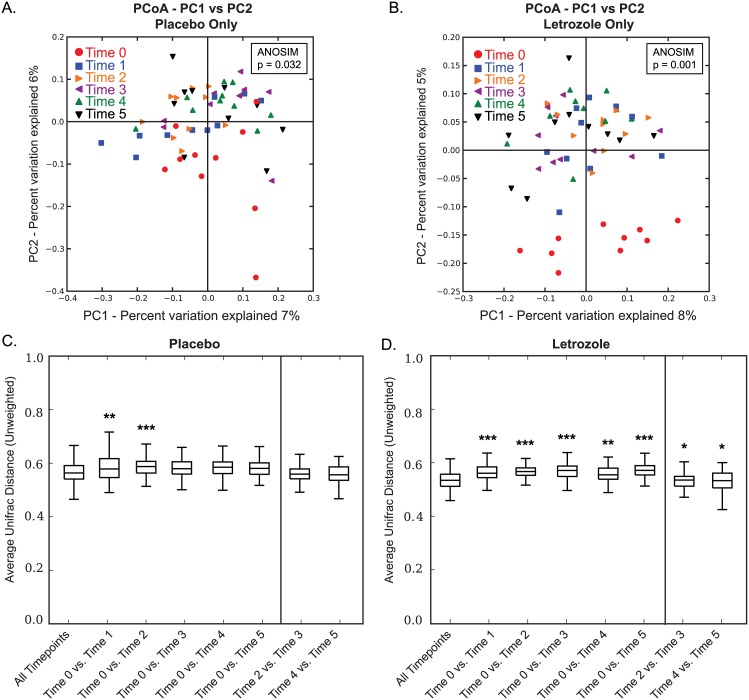
Fig 4. Letrozole results in a shift in beta diversity after one week of treatment.
Principle Coordinates Analysis based on unweighted UniFrac distances. Comparison of samples from placebo-treated mice colored by collection time, week 0–5 (A). Comparison of samples from letrozole-treated mice colored by collection time, week 0–5 (B). Box and whisker plots showing mean and variance of average pair-wise unweighted UniFrac distances between collection time (week) 0 and all other collection time points in the study for placebo (C) and letrozole-treated mice (D). Bars above the graphs indicate when mean differences between time points were significantly different from mean UniFrac distances within all time points, * p<0.05, ** p<0.01, *** p<0.001.

