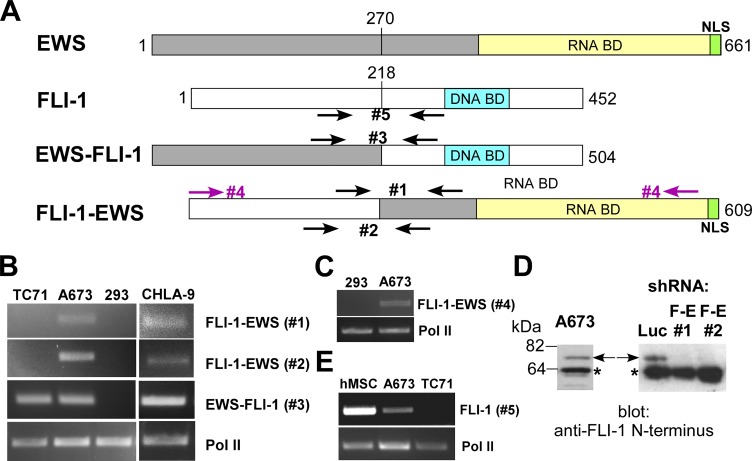
Figure 1. Expression of FLI-1-EWS in Ewing sarcoma cells.
(A) Structure of EWS, FLI-1, EWS-FLI-1, and FLI-1-EWS, and PCR primers used. (B) Expression of FLI-1-EWS in A673 and CHLA-9 Ewing sarcoma cells. FLI-1-EWS or EWS-FLI-1 was amplified using the indicated PCR primers. RNA polymerase II (Pol II) serves as a loading control. (C) Detection of nearly full-length FLI-1-EWS in A673 cells. (D) Endogenous FLI-1-EWS protein expression in A673 cells. A673 cells were infected with lentiviruses expressing shRNAs against FLI-1-EWS or luciferase and were selected with 2 μg/ml puromycin for 2 days. The FLI-1-EWS protein expression was examined by anti-FLI-1 N-terminus antibody immunoblotting. Arrows denote the Fli-1-EWS protein which was silenced by specific shRNAs (FLI- 1-EWS shRNA-1 and 2). Luciferase shRNA serves as a control. Asterisks denote non-specific protein bands. (E) Expression of the FLI-1 mRNA in A673 cells and human mesenchymal stem cells.

