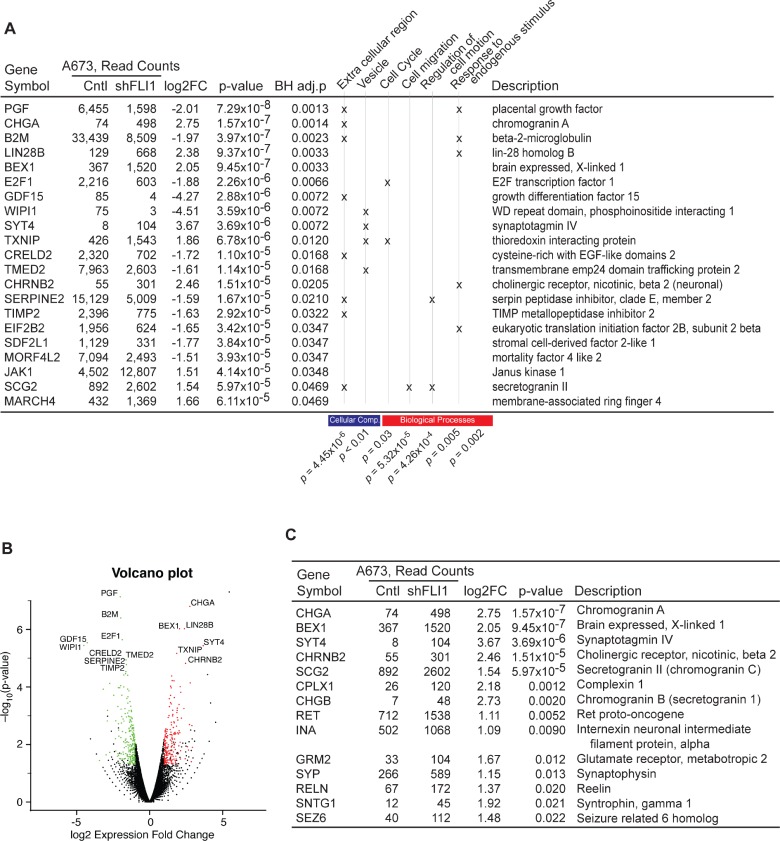
Figure 5. Gene expression changes in FLI-1-EWS-silenced A673 cells.
A673 cells were infected with lentiviruses expressing shRNA against FLI-1-EWS or luciferase and were selected with 2 μg/ml puromycin for 2 days. Four days after infection, total RNA was isolated and global gene expression was analyzed by RNA-sequencing. Differential gene expression analysis was carried out using DESeq software with sequence read counts for each gene evaluated using HTSeq (see Materials & Methods). (A) Twenty one genes whose adjusted p-value < 0.05 (Benjamini-Hochberg correction for multiple test), absolute log2 fold-change > 1, average expression level of control and FLI-1-EWS knockdown > 10, and RPKM > 1 are listed. 419 genes with fold-change > 2 (or absolute log2 fold-change > 1) were selected and submitted to DAVID (see Materials & Methods) for Gene Ontology enrichment analysis. Top six functional clusters with score > 2 were selected. Genes with a specific function are marked with “x”. The enrichment p-value is provided at the bottom. Read counts listed in the table are normalized read counts provided by DESeq. (B) Volcano plot of all genes, with upregulated genes marked in red and downregulated genes in green. (C) List of neural genes induced in FLI-1-EWS-sileneced A673 cells.

