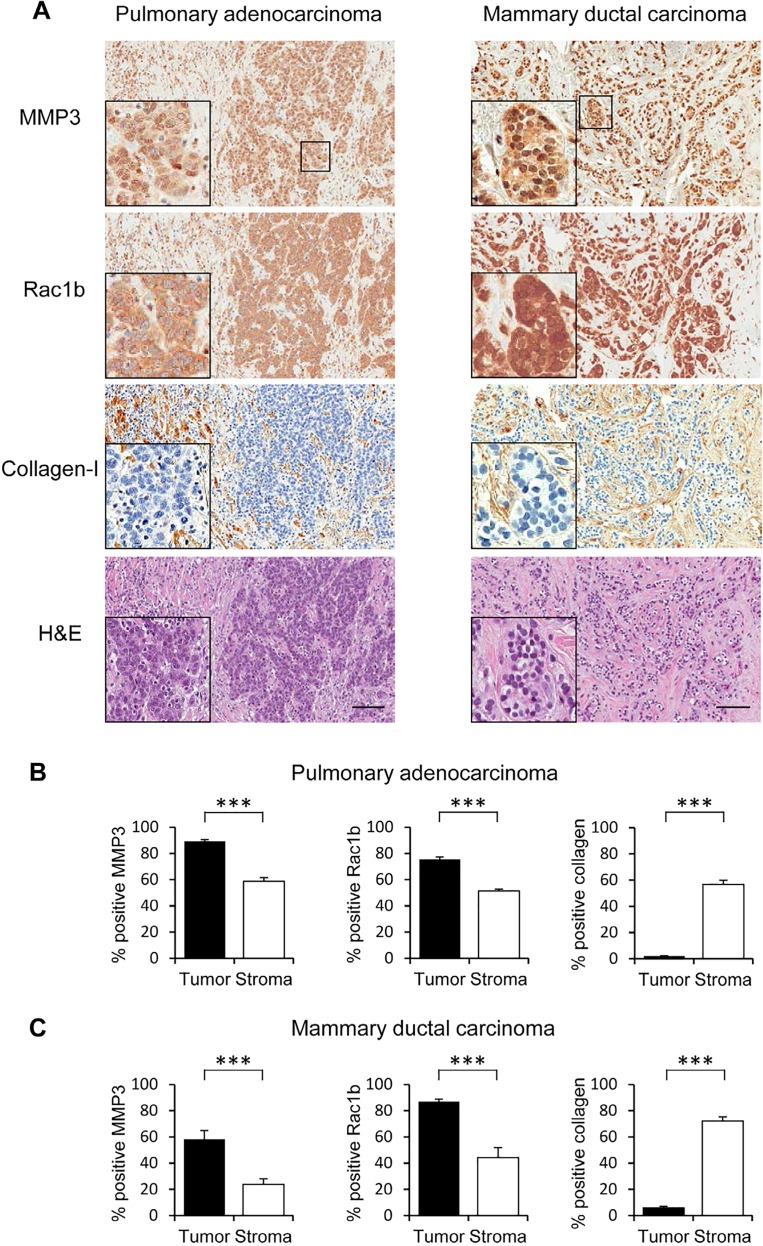
Figure 2. MMP3 and Rac1b tissue expression in pulmonary adenocarcinoma and mammary ductal carcinoma.
Stains for MMP3 and Rac1b show localization in tumor cells; collagen-I demarcates regions of stroma. Scale bar = 100um. Comparing staining intensity using H-score (scale 0-300). (B, C) Staining intensity for MMP3, Rac1b, and collagen-I, reported is an average of six 100um2 slide views, (B) in lung adenocarcinoma with significantly higher intensity in the tumor tissue for MMP3 and Rac1b and higher intensity in the stroma for collagen-I staining. (C) The mean of MMP3 and Rac1b expression intensities are significantly higher in the tumor tissue in contrast to high collagen-I levels in the stroma. (*** p<0.0001 (unpaired t-test), error bars SEM).

