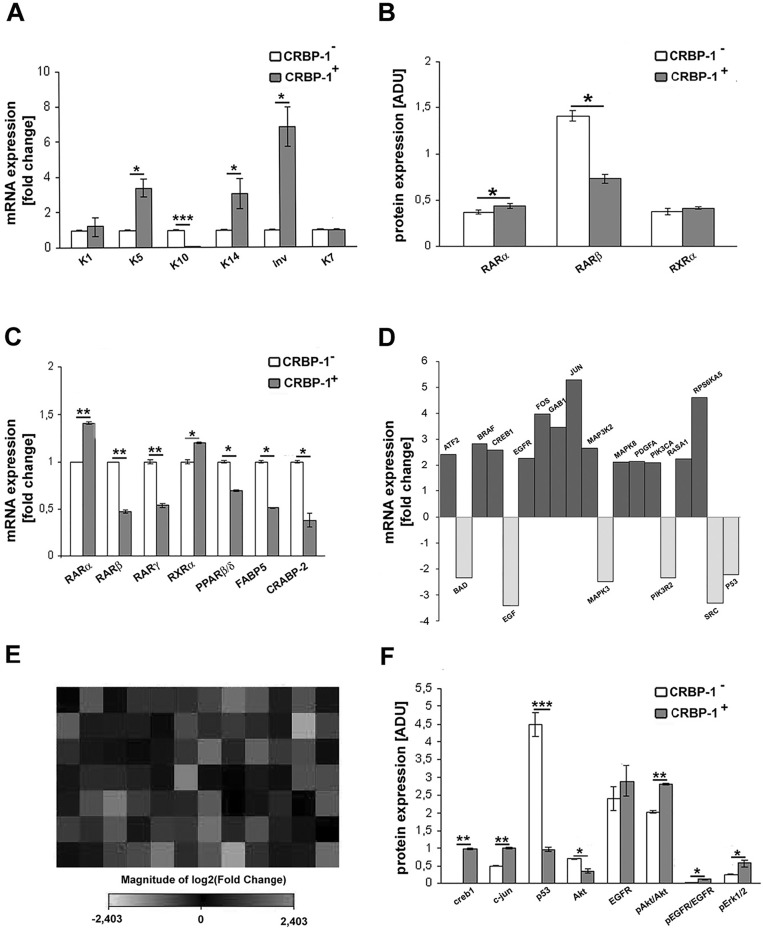
Figure 4. CRBP-1 transfection influences transcriptional pathways and differentiation of A549 adenocarcinoma cells.
A, bar graph after real-time PCR showing keratin (K) 1, 5, 14 and involucrin up-regulation, K10 down-regulation and unmodified K7 transcription level in CRBP-1+ compared to CRBP-1− A549 cells. B, densitometric analysis of RARα, RARβ and RXRα protein expression by blot analysis. C, bar graph of RARs, RXRα, PPARβ/δ, FABP5 and CRABP-2 transcripts. D, bar graph and E, heat map of RT2 profilerTM PCR assay of EGF/PDGF signaling-specific genes in CRBP-1+ A549 cells. Up-regulated and down-regulated genes are in dark grey and light grey, respectively. F, densitometric analysis of creb1, c-jun, p53, pAkt/Akt, pEGFR/EGFR and pErk1/2 protein expression by blots. Columns are means ± SEM of three different experiments. *p < 0.05, **p < 0.005 and ***p <0,001. Abbreviations: ADU, arbitrary densitometric units.

