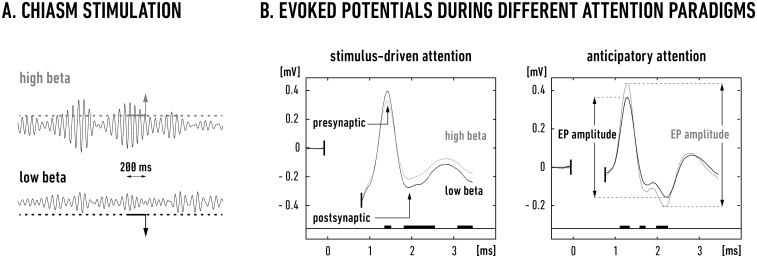
Fig 3. Summary of evoked potentials analysis.
A. The EPs recorded during visual trials were clustered off-line to either high beta or low beta groups based on the strength of the digitally band-pass filtered beta signals (16–24 Hz) preceding chiasmatic stimulation (see the Methods section). The drawing presents two exemplary sweeps of these filtered signals with the corresponding high and low beta amplitudes. The threshold values (dotted horizontal lines) were set based on the average amplitude of the beta signal from all visual trials on a given experimental day. The vertical arrows (matched in time for illustration purposes) indicate the timing of two chiasmatic stimulations that were preceded by 200 ms of the eruption (upper sweep, gray horizontal line) or depression (lower sweep, black line) of beta oscillations. B. Examples of the averaged EPs (recorded for the two behavioral paradigms in two different animals) calculated from the clustered data after beta depression (black lines; means were obtained from 43 clustered EPs in the stimulus-induced and from 32 in the anticipatory task) or beta eruption (gray lines; means were obtained from 47 clustered EPs in the stimulus-induced and 35 in the anticipatory task). Electrical stimulation of the optic chiasm was delivered at time zero (artifact removed from the picture). The thick black horizontal lines denote significant differences between the corresponding values of the two mean EPs at the same latency (Student's t-tests with FDR correction for multiple comparisons; P ≤ 0.05). Note that during the high beta state, the amplitudes of the cortical EPs decreased in the stimulus-driven attention paradigm (cat B, VCx 17/2), and increased in the anticipatory attention paradigm (cat C, VCx 17/3).

