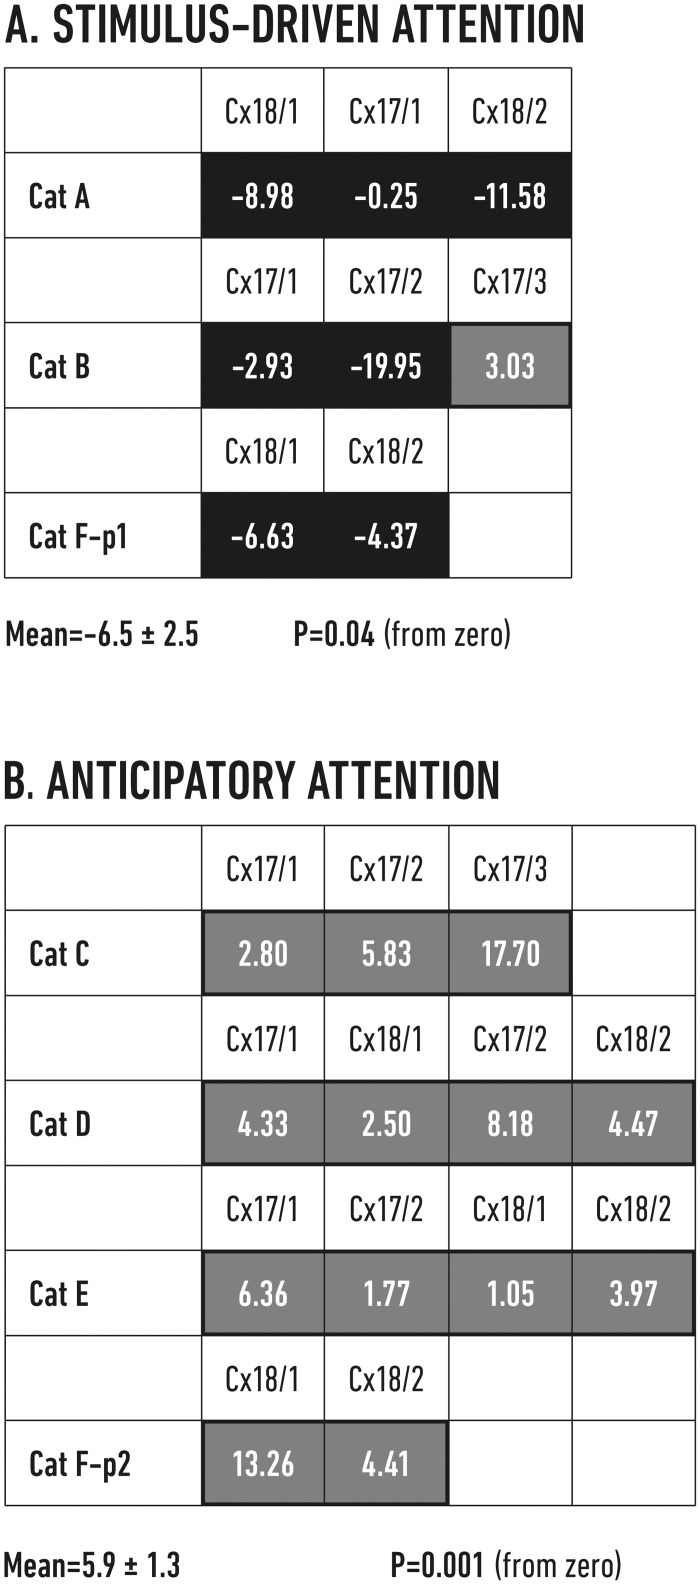
Fig 4. Relative amplitude differences of the evoked potentials during high and low beta states in visual trials.
EPs induced by chiasmatic stimulation during visual trials were analyzed in all recording sites and all cats in the two experimental paradigms (cf. Table 1)—A stimulus driven attention, B—anticipatory attention. Each box shows the normalized percentage difference (Δ%) between the EP amplitudes calculated for the appropriate recording site: Δ% = 100% x (high − low) / low, where “high” indicates the mean amplitude of the EPs that were preceded by bursts of high beta activity and “low” refers to the mean amplitude of the EPs that were preceded by low beta activity. Black boxes = high < low, gray boxes = high > low. Below each table we present mean amplitude change (with SEM) obtained in the relevant paradigm from all available sites and significance of its difference from zero (as P value from one-sample t-test).

