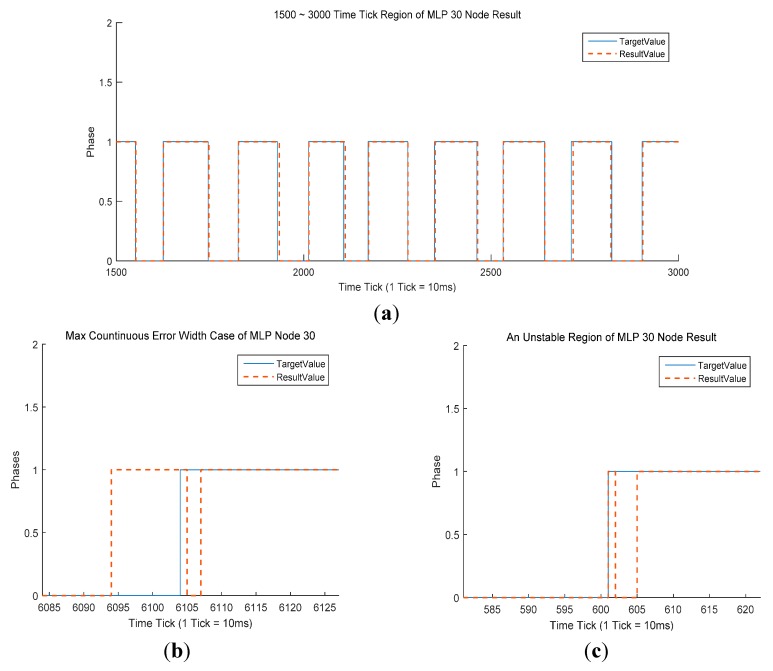
Figure 5.
(a) Comparison of results and target value for the MPL with 30 nodes over frames 1500–3000. The blue line denotes the target value acquired by the force plates. The orange dotted line denotes the classification result of the MLP with a 30-node classifier, the best MLP-based classifier; (b) Max continuous error width for the MLP with 30 nodes; (c) An unstable region for the MLP with 30 nodes.

