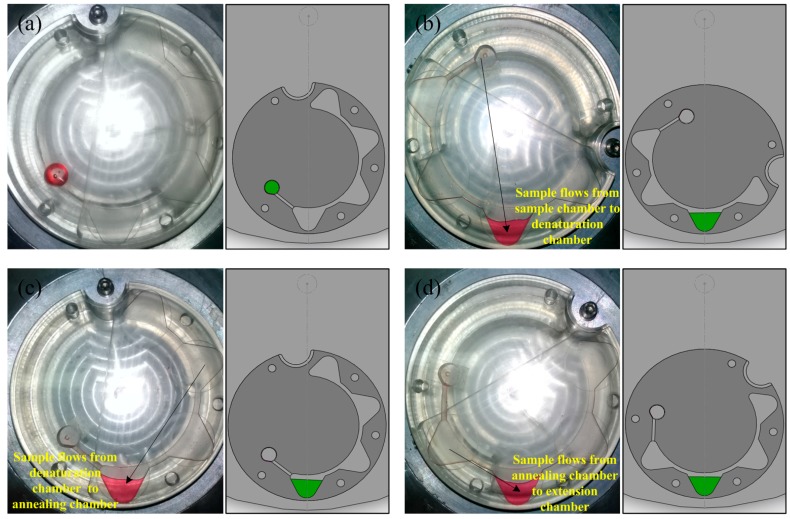
Figure 5.
Images and schematics of fluid flow through the three PCR chambers. (a) The initial position of the PCR disc; (b) 40-μL reaction mixture was pumped to the denaturation chamber from the sample chamber; (c) 40-μL reaction mixture was pumped to the annealing chamber from the denaturation chamber; (d) 40-μL reaction mixture was pumped to the extension chamber from the annealing chamber.

