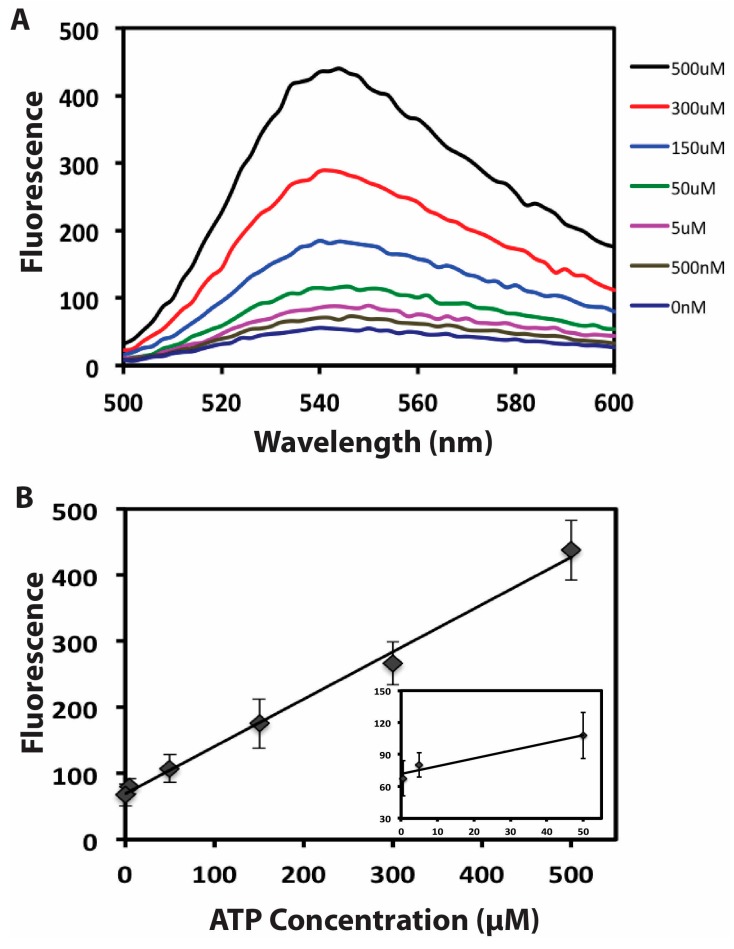
Figure 4.
(A) Fluorescence-emission spectrum for the amplification aptameric DNA biosensor at a 1 h interval in the presence of different concentrations of target ATP; (B) Calibration curve in the standard ATP concentration range of 0.5–500 μM. The inset shows the linearity of the fluorescence response for the sensing system against the low target concentrations. Each data point represents the average value of three independent experiments.

