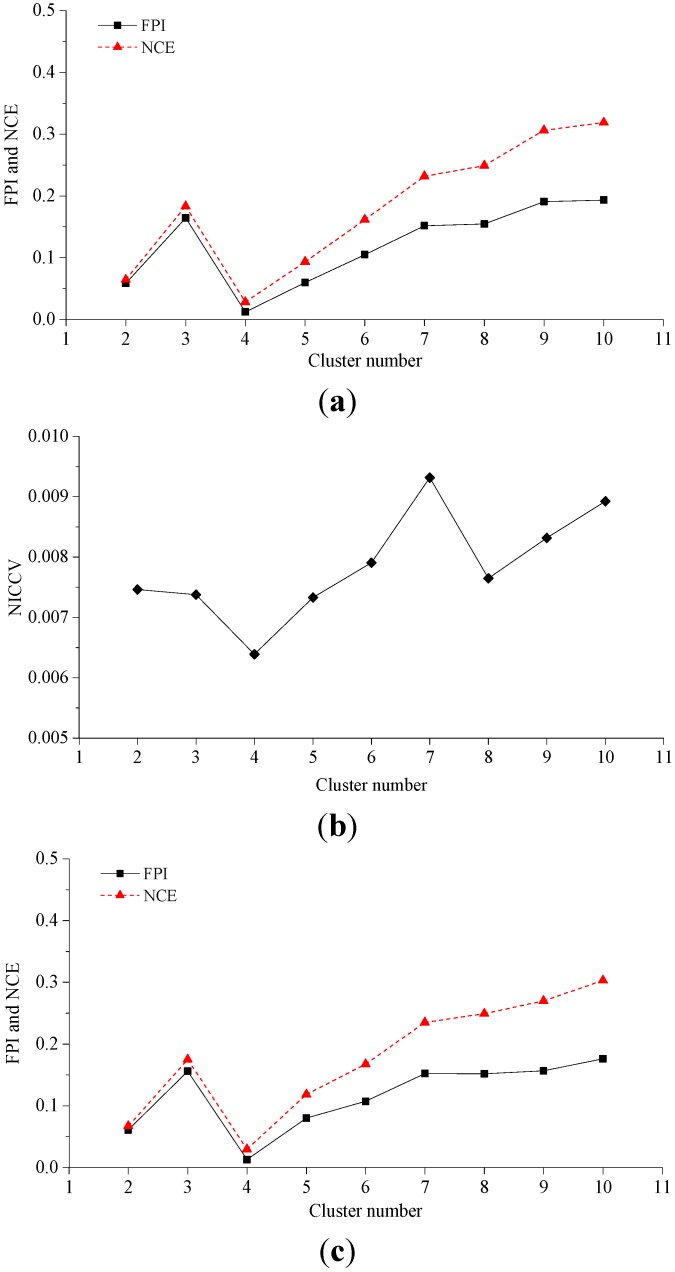
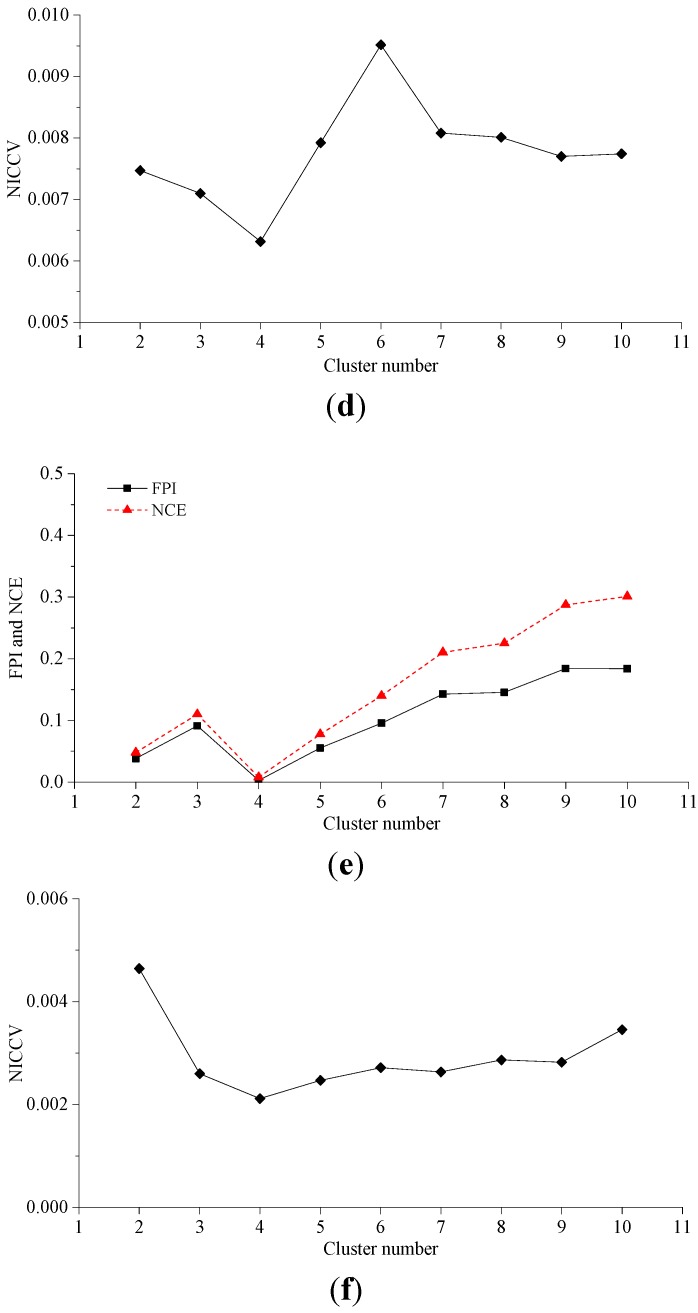
Figure 3.
Dataset 1–3 clustering analysis. (a) Corresponding FPI and NCE to the different cluster numbers of Dataset 1; (b) Corresponding NICCV to the different cluster numbers of Data Set 1; (c) Corresponding FPI and NCE to the different cluster numbers of Dataset 2; (d) Corresponding NICCV to the different cluster numbers of Dataset 2; (e) Corresponding FPI and NCE to the different cluster numbers of Dataset 3; (f) Corresponding NICCV to the different cluster numbers of Dataset 3.


