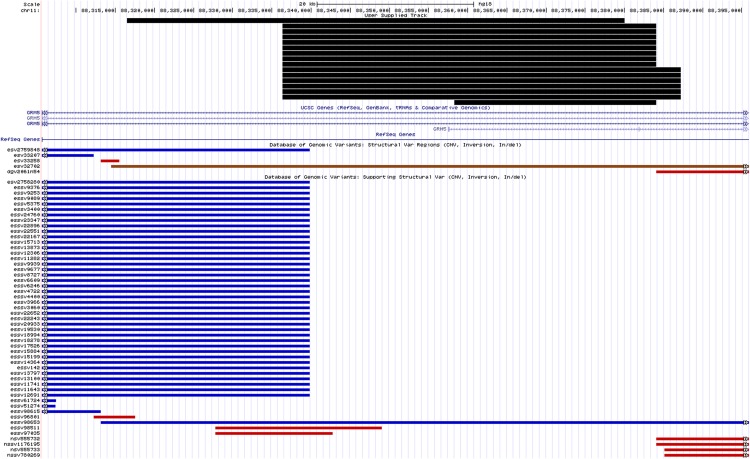
Fig 3. Schematic representation of the genomic organization according to the human genome hg18 at chromosome 11q14.3 with the positions of CNVs called in the region and reported CNVs in the vicinity found in the Database of Genomic Variants, accessed by July 2015.
Blue bars represent gains identified by other studies that were deposited in the database while red bars represent losses. Brown bars depict CNVs with both losses and gains documented.

