
Figure 4.
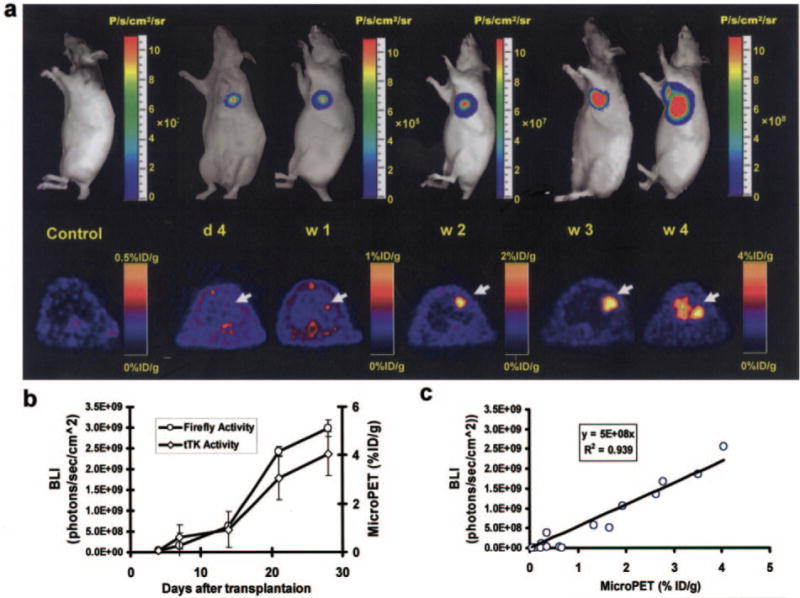
Molecular imaging of transplanted ES cells with bioluminescence and PET imaging. a, To assess longitudinal cell survival, animals were imaged for 4 weeks. A representative study animal injected with ES-TF cells showed significant bioluminescence (top) and PET (bottom) signals at day 4, week 1, week 2, week 3, and week 4. In contrast, control animals had background activities only. b, Quantification of imaging signals showed a drastic increase of fluc and ttk activities from week 2 to week 4. Extracardiac signals were observed during subsequent weeks. c, Quantification of cell signals showed a robust in vivo correlation between bioluminescence and PET imaging (r2=0.92). BLI indicates bioluminescence.