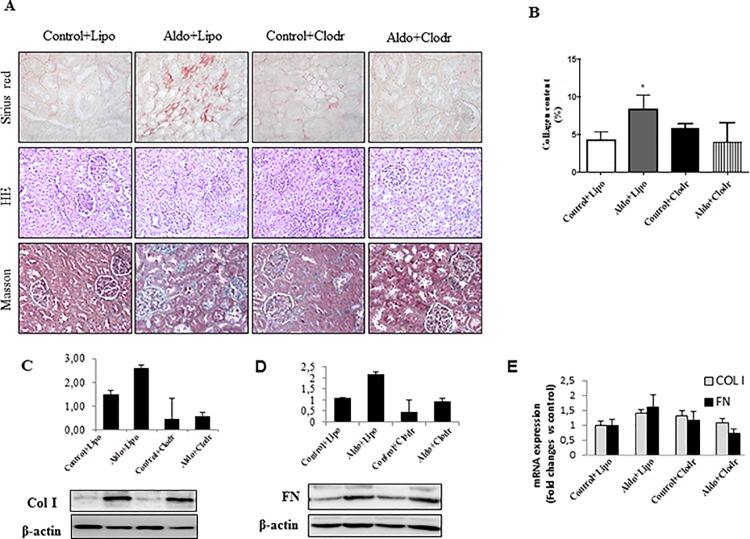
Fig 6. (A) Representative images showing Sirius red staining, Masson trichrome and Hematoxilin/Eosin staining in control+PBS liposome (Control+Lipo), aldosterone+PBS liposome (Aldo+Lipo), control+clodronate liposome (Control+Clodr), or aldosterone+clodronate liposome (Aldo+Clodr) treated animals. Kidney collagen content (B), quantitative analyses of Col I and Fibronectin (FN) protein (C-D) and mRNA expression (E) in treated rats.
Data are expressed as mean ± SEM. *p<0.05 vs Control+Lipo; #p<0.05 vs. Aldo+Lipo.

