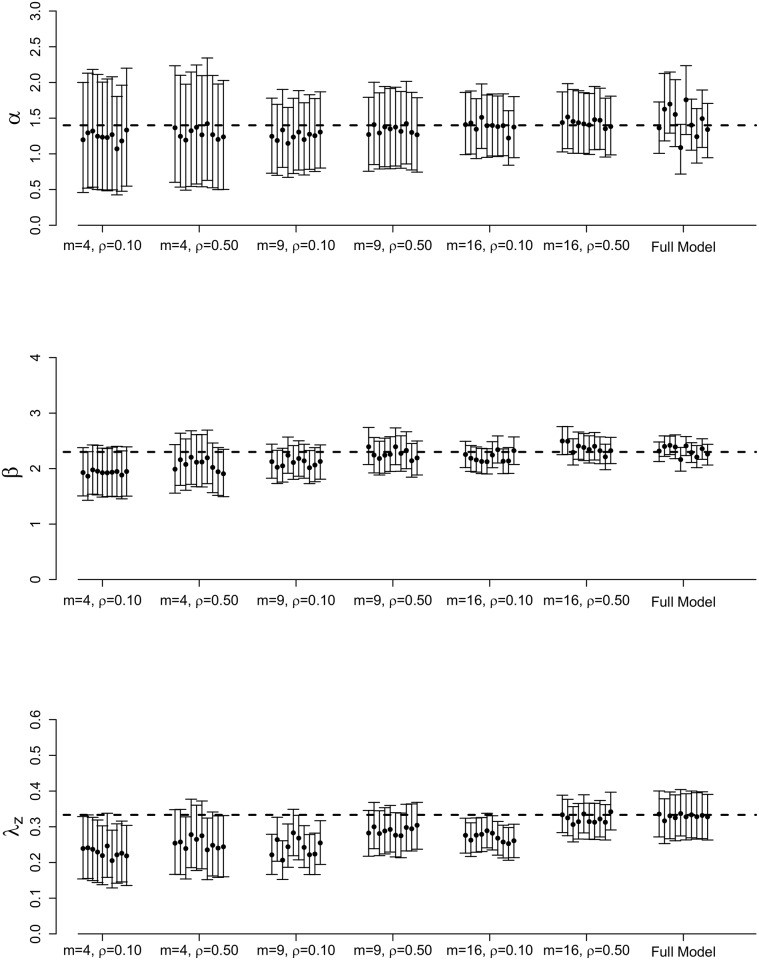
Fig 3. Full posterior results for full MCMC and spatial stratification methods.
Posterior means and 95% credible intervals for α, β, and λz for the full MCMC and spatial stratification methods for 10 different epidemics simulated from the data augmented spatial ILM with varying values for m and ρ. The dashed, horizontal lines represent the true parameter values: α = 1.4, β = 2.3, and , with a population of size n = 625.

