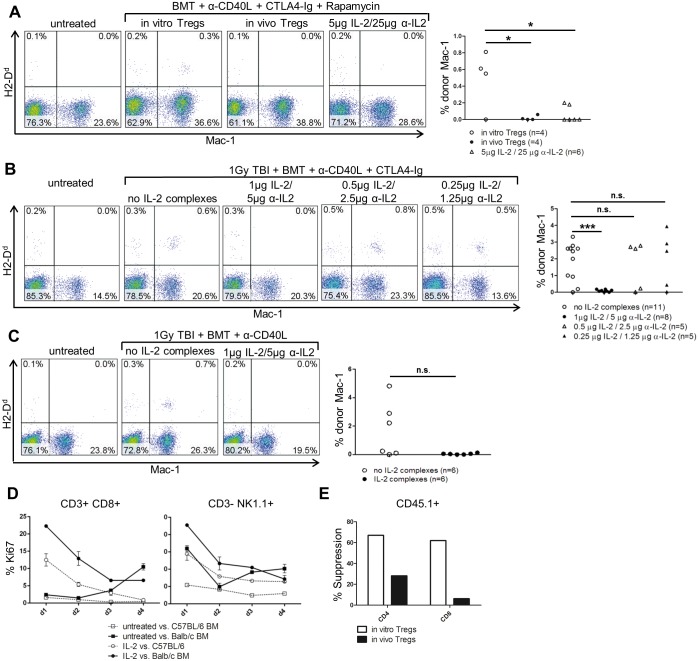
Fig 1. IL-2 complexes promote BM rejection.
The ability of IL-2 complexes to replace Treg therapy was tested in different BMT models. Donor chimerism was analyzed in blood 14 days after transplantation by staining the BALB/c specific marker H2-Dd on myeloid (Mac-1) cells. (A) IL-2 complexes were less effective than Treg therapy in promoting BM engraftment. Naïve C57BL/6 mice were grafted with 20×106 unseparated BALB/c BM cells (d0) under the cover of costimulation blockade (α-CD154, CTLA4Ig) and a short course of rapamycin. The recipients were additionally treated with either in vitro activated Tregs (3×10⁶) (n = 4), IL-2 complex expanded Tregs (3×10⁶) (n = 4) or IL-2 complexes (5μg IL-2 / 25μg α-IL-2; d-4, d-3, d-2) (n = 6). Two color flow cytometry plots are shown from representative BMT recipients (left). Each dot of the scatter diagram represents one mouse from one experiment (right) [in vitro Tregs vs. in vivo Tregs: p = 0.0341; in vitro Tregs vs. IL-2 complexes: p = 0.0187]. (B) IL-2 complexes enhanced BM rejection. Naïve C57BL/6 mice received a total body irradiation of 1Gy, costimulation blockade (α-CD154, CTLA4-Ig), as well as 20×106 unseparated BALB/c BM cells (d0) with varying doses (1μg IL-2 / 5μg α-IL-2, n = 8; 0.5 μg IL-2 / 2.5μg α-IL-2, n = 5, 0.25 μg IL-2 / 1.25μg α-IL-2, n = 5) of IL-2 complexes; (d3, d5) or without IL-2 complexes (n = 11). Two-color flow cytometry plots are shown from representative BMT recipients (left). Each dot in the scatter diagram depicts one mouse from two individual experiments (right) [no IL-2 complexes vs. 1μg IL-2 / 5μg α-IL-2 p = 0.0004; no IL-2 complexes vs. 0.5μg IL-2 / 2.5μg α-IL-2: p = 0.7769, no IL-2 complexes vs. 0.25μg IL-2 / 1.25μg α-IL-2: p = 0.8966]. (C) Omission of CTLA4-Ig did not reverse the detrimental effect of IL-2 complexes. Naïve C57BL/6 mice were irradiated with 1Gy TBI before receiving costimulation blockade (α-CD154) and 20×106 unseparated BALB/c BM cells (d0) with (1μg IL-2 / 5μg α-IL-2; d3, d5) (n = 6) or without IL-2 complexes (n = 6). Two-color flow cytometry plots are shown from representative BMT recipients (left). Each dot in the scatter diagram shows one mouse from one experiment (right) [p = 0.0627]. (D) IL-2 complexes increased the reactivity of CD8 T cells and NK cells toward donor antigens. Splenocytes from untreated mice or mice treated with IL-2 complexes were stimulated in vitro with irradiated BALB/c (allogeneic) or C57BL/6 (syngeneic) BM cells. The proliferation of CD8 T and NK cells was assessed by measuring the proliferation marker Ki67. Each symbol represents 2 mice from one experiment. (F) 4×10⁵ responder splenocytes from congenic CD45.1 mice were stimulated in vitro with α-CD3 and co-cultured with equal number of either in vitro activated or IL-2 complex expanded Tregs.

