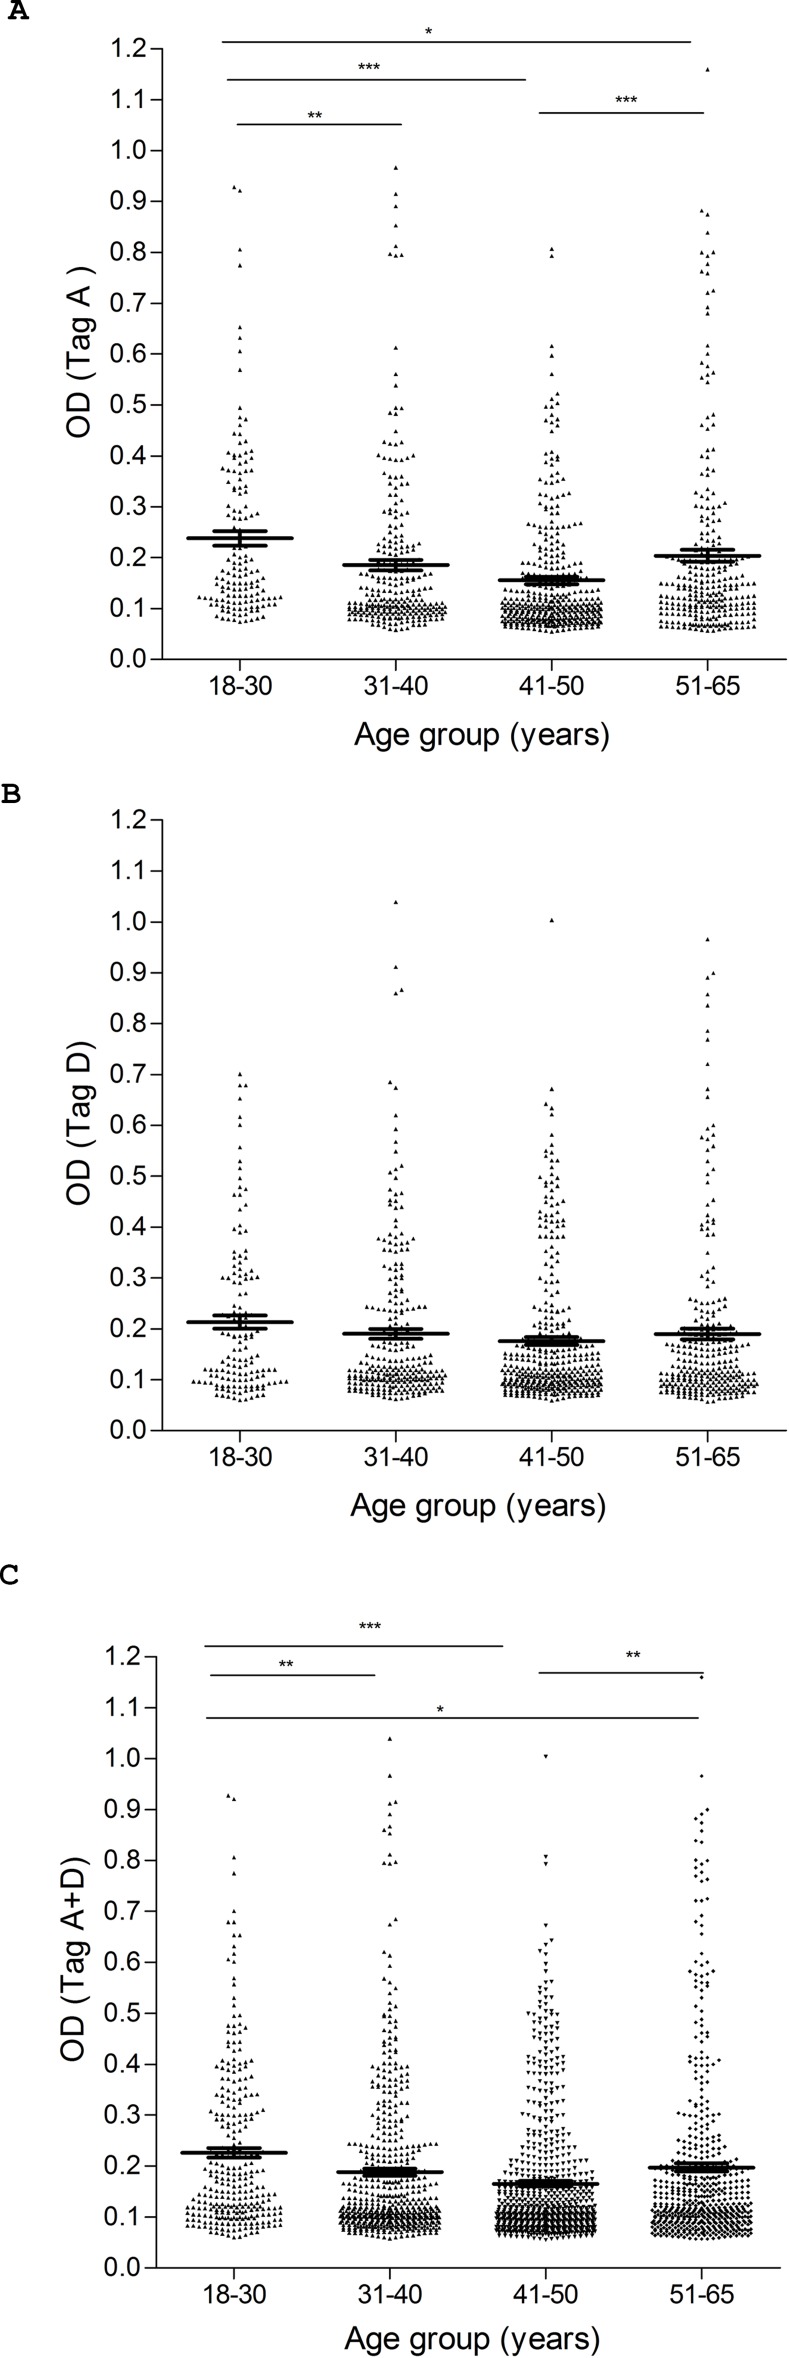
Fig 5. Serologic profile of human serum antibody reactivity to SV40 large T antigen mimotopes Tag A (A), Tag D (B) and Tag A+D (C).
Immunologic data are from healthy subjects (HS). Results are presented as values of OD readings at λ 405 nm for serum samples diluted 1:20 and assayed in indirect ELISA. In this scatter dot plotting, each plot represents the dispersion of individual sample OD values to a mean level, indicated by the long horizontal line inside the scatter with standard error of the mean (SEM) marked by short horizontal lines for each age group. The OD readings of serum samples were stratified by age: 18–30 years (yrs), 31–40 yrs, 41–50 yrs, and 51–65 yrs. Data were analyzed with one way Anova analysis and Newman-Keuls Multiple Comparison test (OD mean, 95% CI). (A) High levels of antibodies against SV40 Tag A in HS aged 18–30 yrs (0.24 OD, 95% CI = 0.21–0.27) vs. HS aged 31–40 yrs (0.18 OD, 95% CI = 0.16–0.20, **P < 0.01), vs. HS aged 41–50 yrs (0.15 OD, 95% CI = 0.14–0.17, ***P < 0.001), vs HS aged 51–65 (0.20 OD, 95% CI = 0.18–0.23, *P<0.05). High levels of antibodies against HS aged 51–65 yrs vs HS aged 41–50 yrs (***P<0.001). (B) Levels of antibodies against SV40 Tag D were not statistically different among age groups of HS (P > 0.01). (C) High levels of antibodies against both SV40 Tag peptides Tag A+D were observed in HS aged 18–30 yrs (0.23 OD, 95% CI = 0.21–0.24) vs. HS aged 31–40 yrs (0.19 OD, 95% CI = 0.17–0.20, **P < 0.01), vs. HS aged 41–50 yrs (0.16 OD, 95% CI = 0.15–0.18, ***P < 0.001), and vs HS aged 51–65 yrs (0.20 OD, 95% CI = 0.18–0.21, *P<0.05). High levels of antibodies against HS aged 51–65 yrs vs HS aged 41–50 yrs (**P<0.01).

