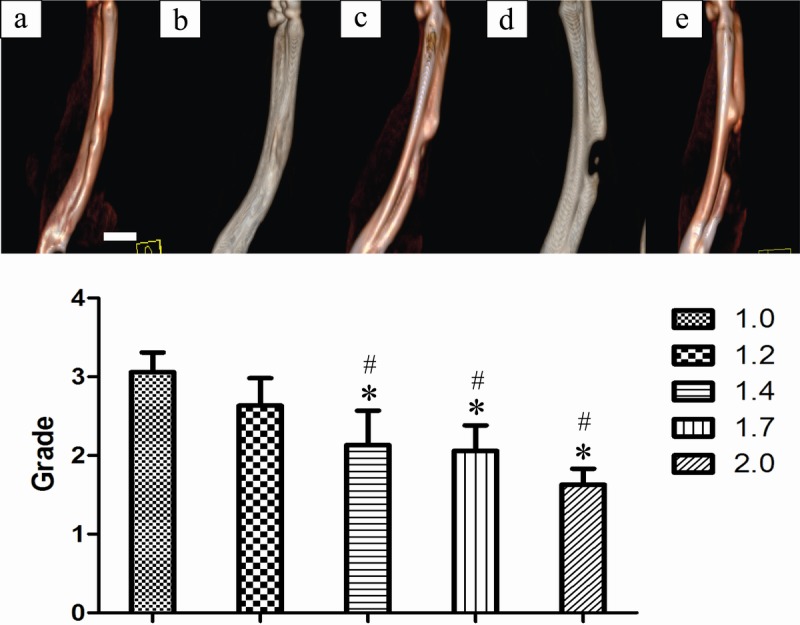
Fig 6. Radiographic grades of 1.0-cm and 1.2-cm groups showed more new bone formation on the Computer tomograph (CT).

CT scans of different radial defects 12 weeks postoperatively. * P <0.05 compared with 1.0-cm groups, and # P <0.05 compared with 1.2-cm groups. Column graph b (1.2-cm group) showed no statistically significant difference with column graph a (1.0-cm group) (P >0.05). (a: 1.0cm, b: 1.2cm, c: 1.4cm, d: 1.7cm, e: 2.0 cm, scale bar: 10mm, Grade: value of score).
