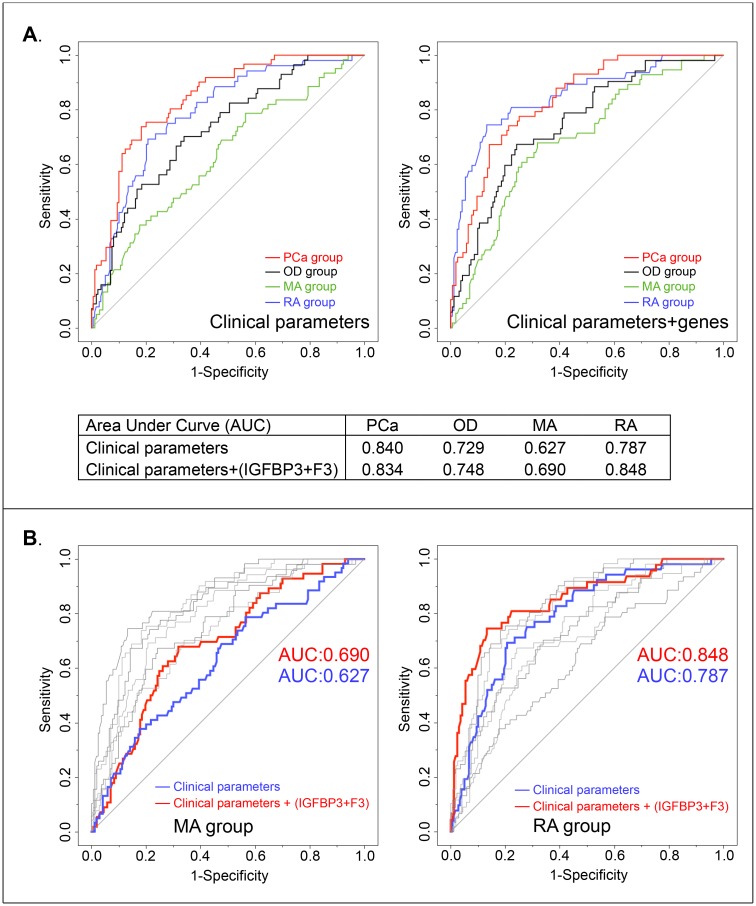
Fig 2. ROC curves for grouping variable survival prediction.
(A) The grouping variable predictions for four patient subgroups (RA group: blue line, MA group: green line, OD group: black line and PCa group: red line) were determined by the clinical parameters alone (Left part), and by both clinical parameters and the expression levels of IGFBP3 and F3 (Right part). The area under the curve (AUC) values of predictions for OD, MA and RA groups were increased by adding expression levels of the two genes. (B) We overlapped all ROC curves generated from the two models in one graph, color marked the ROC curves only for MA group (Left part) and RA group (Right part). ROC curves modeled from clinical parameters only are marked with red color, from clinical parameters combined together with the two gene variables are marked with blue color. We observed that adding gene variables increased AUC values of predictions for MA and RA groups.

