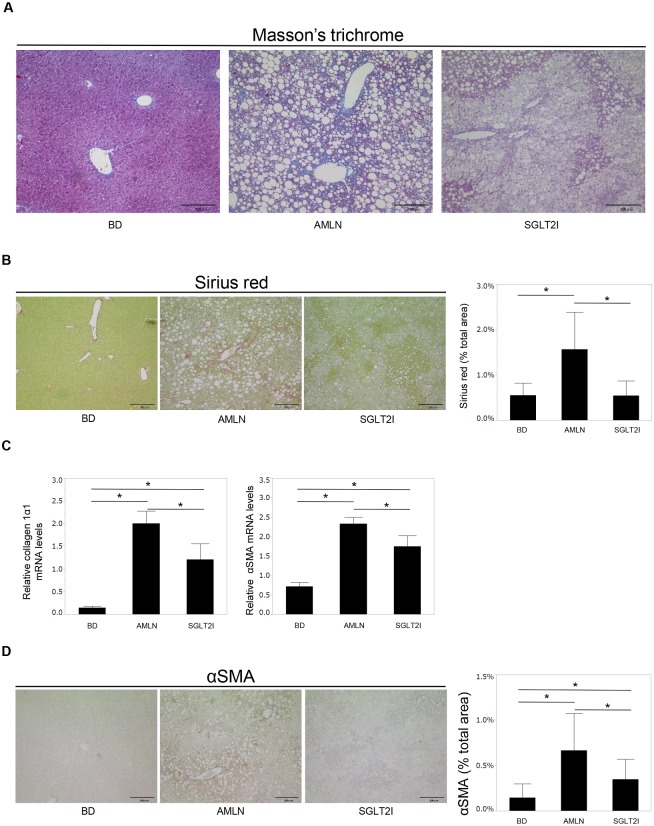
Fig 3. Ipragliflozin improved fibrosis.
(A) Liver sections from BD, AMLN and SGLT2I mice. Masson’s trichrome (MT), (B) Sirius red (SR) staining. Areas of SR staining in the liver of BD, AMLN, and SGLT2I mice (n = 5–8). (C) Expression of collagen 1α1 mRNA, and α-smooth muscle actin α (α-SMA) mRNA in BD, AMLN, and SGLT2I mice (n = 5–8). (D) α-SMA-stained paraffin-embedded sections of liver tissue from BD, AMLN, and SGLT2I mice. Areas of α-SMA staining in the livers of BD, AMLN, and SGLT2I mice (n = 5–8). Magnification, 200×. Scale bars: 200 μm. Results are the mean ± SD. Significance was determined using the Student’s t-test (*p<0.05).

