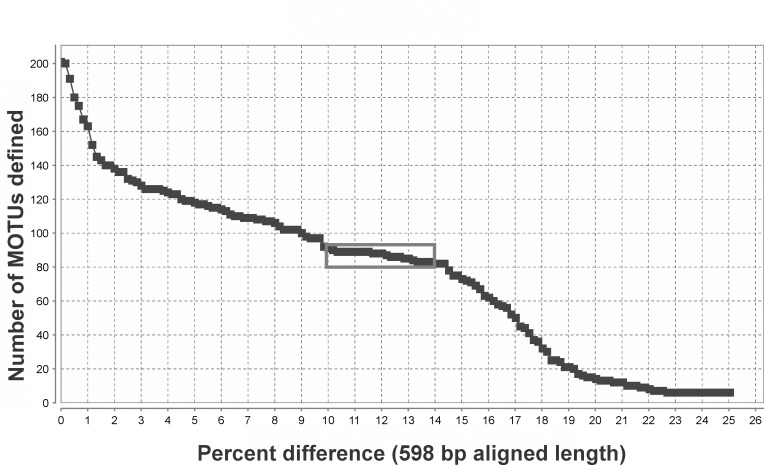
Fig 5. Comparison between numbers of MOTUs and described species.
Number of MOTUs inferred from the barcode alignment trimmed to 598 base-pairs using a range of cut-offs (x-axis) expressed as percentage differences. The analyzed data include 78 described species, of which eight are hypothesized to include two or three cryptic species. The box defines a flat section of the graph ranging from 10% sequence difference (defining 91 species) to 14% (82 species).

