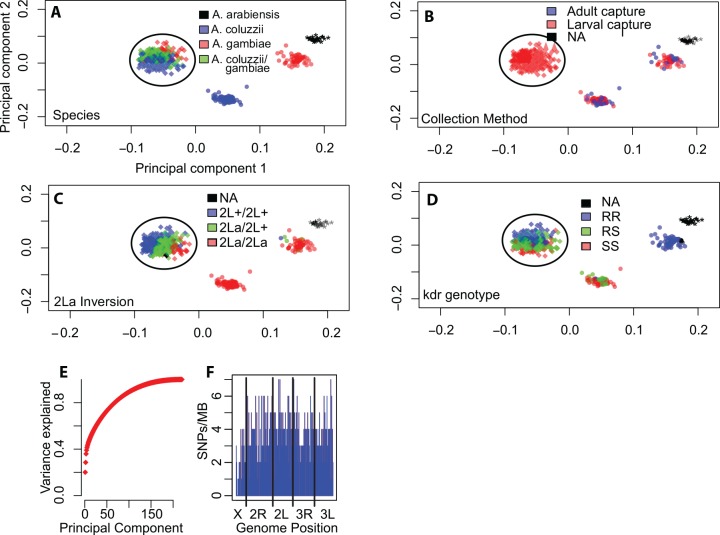
Fig 1. A comprehensive image of population structure is provided by genome-wide SNP typing in a local Anopheles population.
Principal component analysis (PCA) was performed on 812 genome-wide, uniformly spaced SNPs typed in 422 individual mosquitoes collected in the village of Goundry, Burkina Faso over two years. A-F, Symbol color represents genetic attributes determined by molecular assays. A) species, B) collection method, C) genotype of 2La inversion, and D) genotype of kdr insecticide resistance-associated SNP. Axis labels for (A-D) as in (A). E) The cumulative variance of the PCA explained as a function of the number of principal components. The first two components explain greater than 25% of the variation. F) Distribution of SNP markers across the genome. Vertical blue bars indicate the number of SNPs per Mb, vertical black bars indicate the breakpoints between chromosome arms. The circled cluster in all panels indicates those individuals belonging to the Goundry form.

