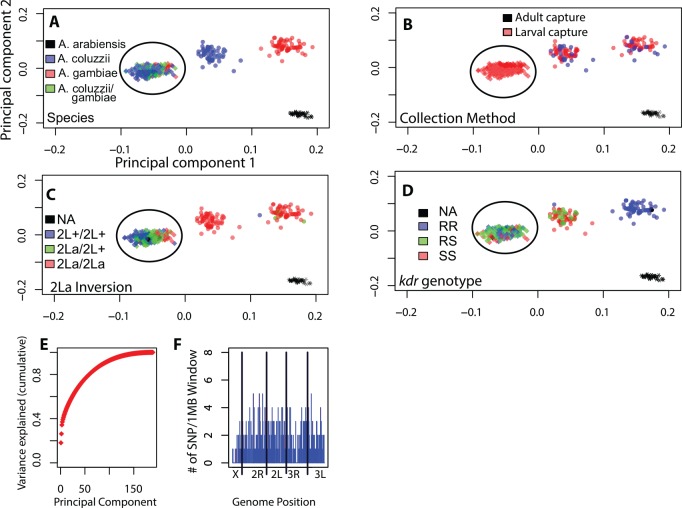
Fig 2. Identical population substructure is detected with half the number of SNPs.
The same PCA analyses as in Fig 1 were repeated with 400 randomly sub-sampled SNPs, revealing the same four population subgroups. Panel labels (A-F) as in Fig 1. Note the Principal Component 2 is in opposite polarity to Fig 1, hence the presence of the A. arabiensis cluster in the lower right hand corner. Circled cluster indicates individuals belonging to the Goundry form.

