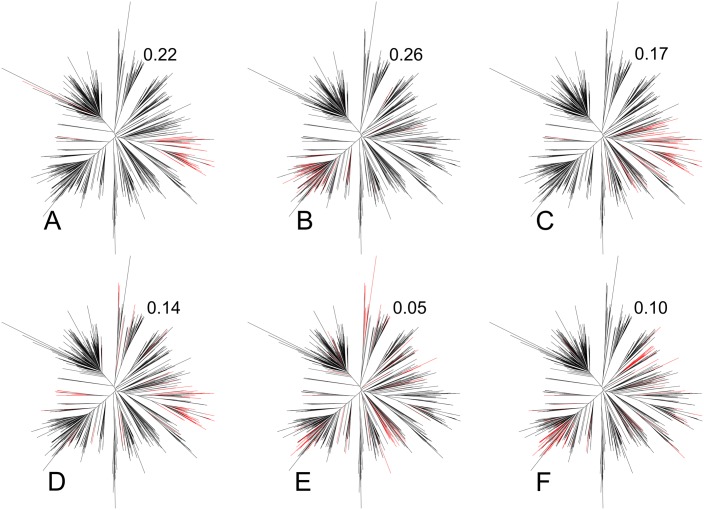
Fig 4. Phylogenetic distribution of feature-carrying sequences and phylogenetic bias indicator B.
The distance-based phylogenetic tree in all six panels was computed for the same set of 788 East Asian HIV-1 gag protein sequences obtained from the HIV sequence database at http://www.hiv.lanl.gov. In each panel, those branches are colored red that correspond to sequences that carry an amino acid substitution apparently associated with a certain HLA type. The numbers to the upper right of each tree are the corresponding values of the bias indicator B, Eq (4).

