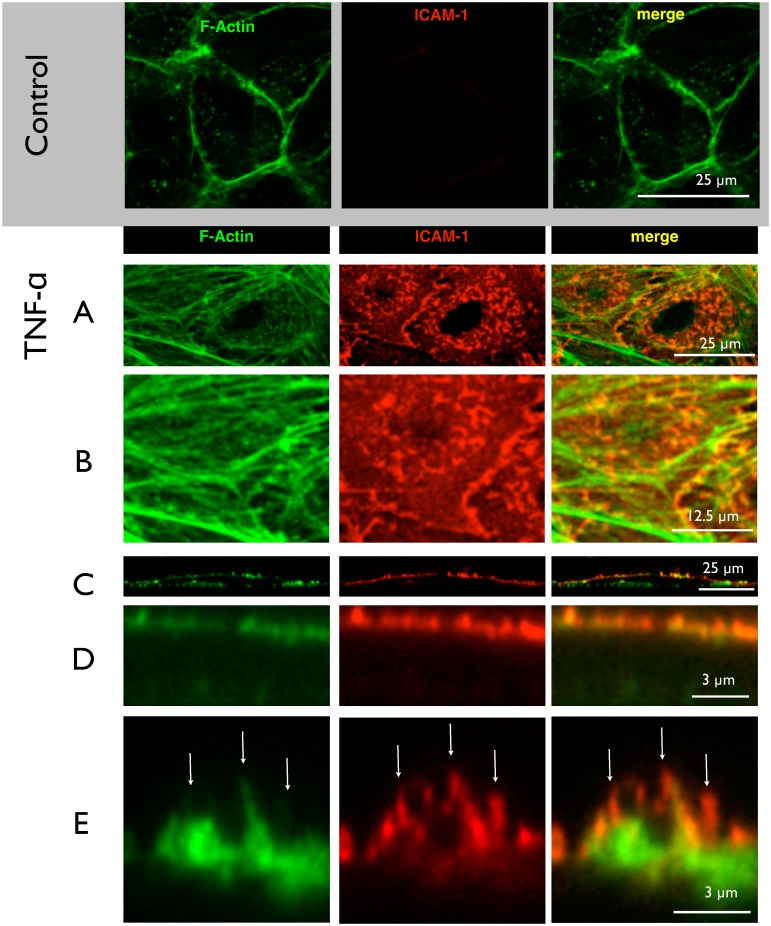
Fig 2. Immunostaining of ICAM-clusters.
HUVECs before or after treatment with TNF-α were subjected to fluorescent staining for f-actin using phalloidin and immunolabeling for ICAM-1 using antibodies, respectively. The focal planes of confocal laser scanning microscopy (LSM) were adjusted to the apical surface. (A) represents a maximum intensity projection. ICAM-1 immunoreactivity is virtually absent from control cells and the actin forms a belt at the cell periphery along the junctions. Upon activation with (TNF-α), f-actin forms stress fibers (A), which exhibit many short debranchings as seen in the zoomed image (B). The ICAM-1 adhesion protein forms a punctuate pattern of elongated or even triangular spots with diameter of around 1 μm (A) They are distributed around the perinuclear area of the cell and are often located at the debranching sites (B). The reconstructed side view (C) shows f-actin both at the basal and apical areas, and ICAM-1 only at the apical surface. (D) A closer view on the apical surface demonstrates the clustered appearance and colocalization of ICAM-1 and f-actin. (E) A highest-resolution micrograph reveals a microvilli of more than 1 μm height which are decorated with ICAM-1 (white arrows). As seen from the merged image, ICAM-1 is mostly accompanied by f-actin but not the other way round. Images shown are representative for 3 independent cell preparations. In A and B, it is maximum intensity projections, while C-E are single slices in xz-plane (x = z scale).

