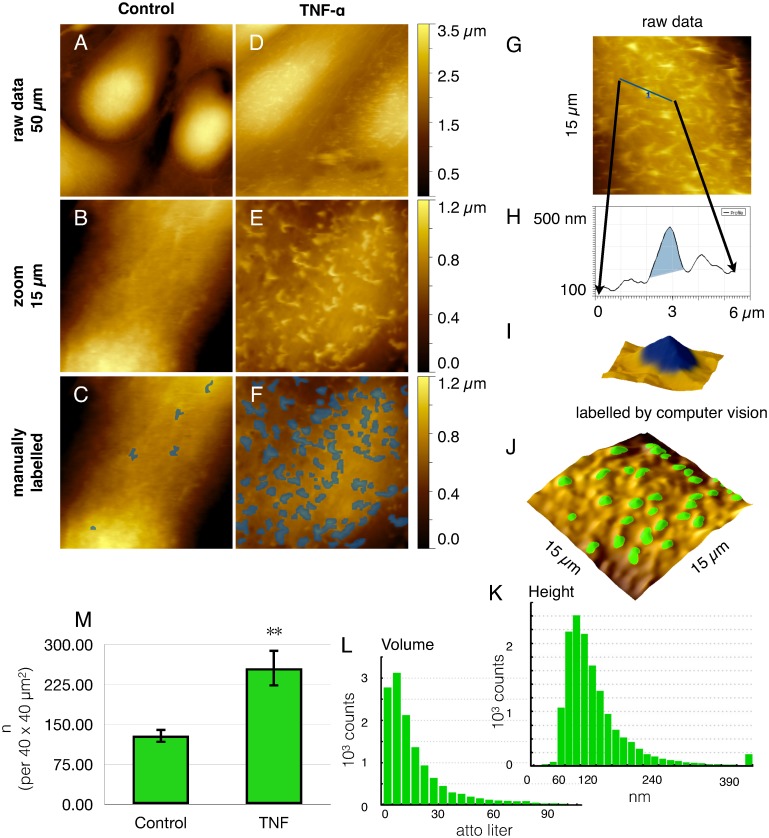
Fig 3. Quantitation of nanoscale surface protrusions.
For morphological phenotyping of endothelial cell surfaces (HUVEC) were recorded by atomic force microscopy (AFM) without (A-C) or (D-J) after treatment with TNF-α. (A, D) An (50 μm)² overview demonstrates the cell bodies to become (D) longer and flatter after stimulation as compared to (A) controls, which exhibit a smoother surface. (B, E) Higher resolution to a (15 μm)2 scan reveals the microvilli, which have been manually marked blue in C and F, respectively. Here, contrasting examples are chosen for the sake of clarity. To achieve objectivity, computer vision was employed for the enumeration of nanostructures (G-M), referred to as nAnostic method. From raw data as in (G), profiles (H) and 3D-representations (I) were marked by an operator (in blue) to train the machine (supervised learning, for details see methods section). On the basis of identified objects, histograms of height (K) and objects‘ volume (L) were given for morphometrical profiling. Typical dimensions of the microvilli are 160 ± 80 nm height and a volume of 10–20 attoliter (10E-18 l). Finally, the increase of object count from 129 ± 14 objects / (40 μm)2 without to 260 ± 40 objects / (40 μm)2 with TNF-α clearly indicates cell activation(M). Shown are the mean values ± SEM of 20 images out of three independent experiments. ** p<0.01 student’s t-test.

