
Figure 1.
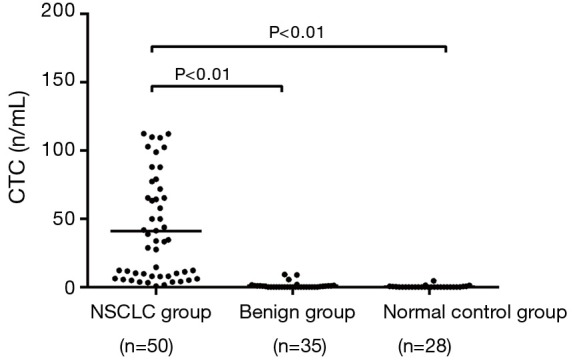
Comparison of CTC count in NSCLC group, lung benign tumor group and control group. The peripheral CTC levels showed skew distribution in the NSCLC group, benign group, and normal control group.
Official websites use .gov
A
.gov website belongs to an official
government organization in the United States.
Secure .gov websites use HTTPS
A lock (
) or https:// means you've safely
connected to the .gov website. Share sensitive
information only on official, secure websites.
Comparison of CTC count in NSCLC group, lung benign tumor group and control group. The peripheral CTC levels showed skew distribution in the NSCLC group, benign group, and normal control group.