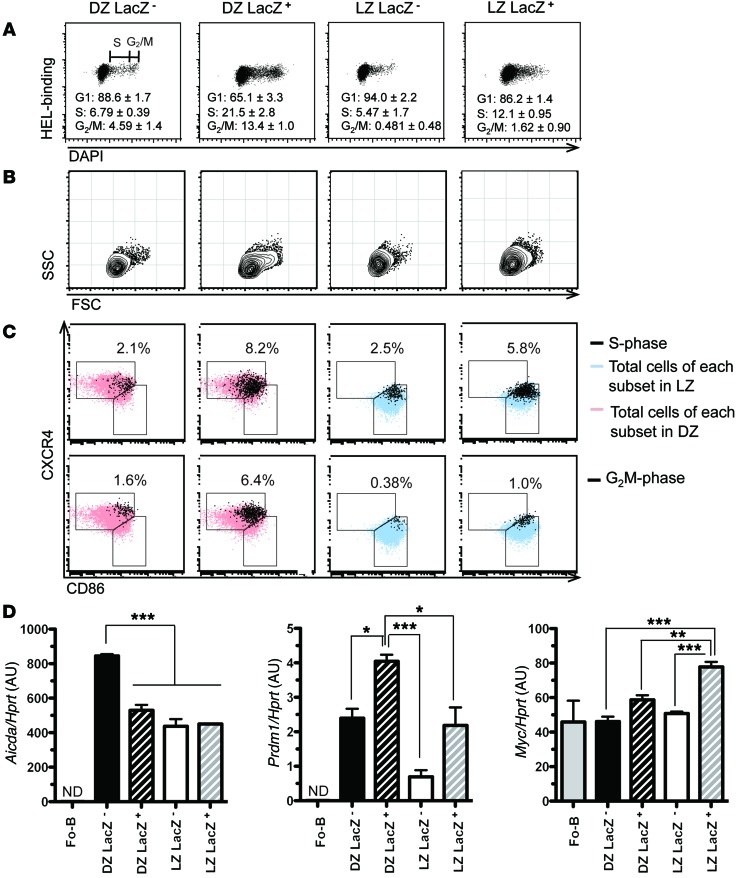
Figure 3. miR-155 expression is associated with cell cycle progression of GC B cells.
SWHEL Mir155LacZ/+ B cells were adoptively transferred into CD45.1+ congenic recipient mice, which were then injected with HEL3X-SRBC and analyzed after 5 days. LacZ reporter staining is incompatible with permeabilization and, therefore, cells were sorted first using the strategy explained in Figure 2A. Subsequently, cell cycle was analyzed in the 4 subsets of GC B cells by DAPI staining. The mean of the indicated fraction ± SEM from 3 independent experiments is shown. (A) HEL-binding vs. DAPI. (B) Forward scatter (FSC) vs. side scatter (SSC). (C) S-phase and G2/M-phase B cells for each of the sorted subsets were gated as shown in A. The upper panel shows the CXCR4/CD86 distribution of cells in S-phase cells (black dots) superimposed on DZ cells (pink) or LZ cells (light blue) of the indicated subset. The lower panel is similar to the upper panel, except that G2/M-phase cells (black) are shown. The percentage of black dots over total cell per gate is shown. A representative FACS plot of the indicated subset out of 3 independent experiments is shown (A–C). (D) The indicated subsets were sorted at day 5 after HEL3x-SRBC immunization. Aicda, Prdm1, and Myc transcripts levels were analyzed by qPCR and normalized by Hprt. Naive follicular B cells (Fo-B) were sorted as B220+AA4.1–CD21/35intCD23hi cells from 2 naive mice. The experiment shown is representative of 3 independent sorting experiments. In each experiment, cDNA was prepared from sorted cells after pooling 5–10 mice. The mean ± SEM is shown. *P < 0.05, **P < 0.01, ***P < 0.001 using 1-way ANOVA followed by a Tukey’s multiple comparisons post-test.

