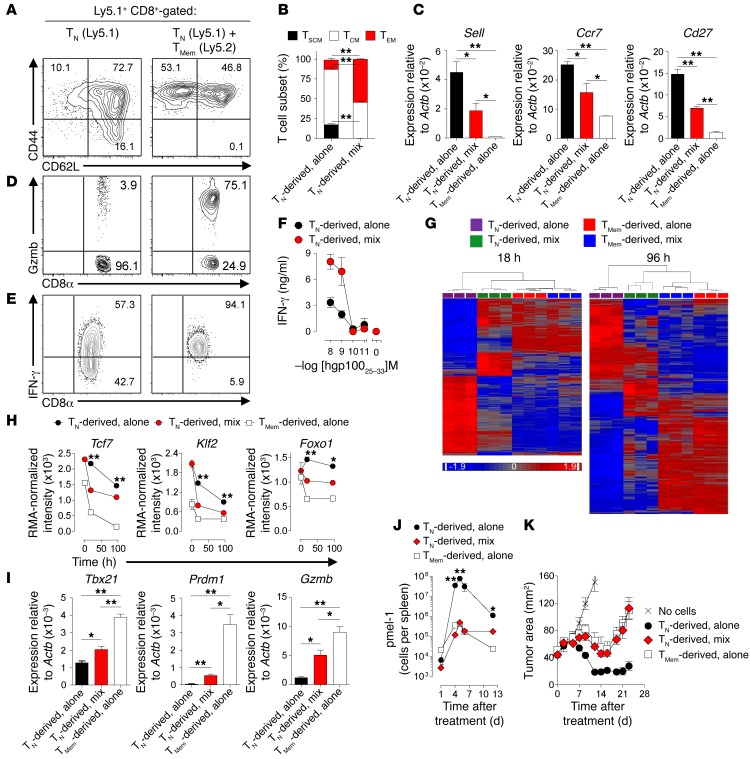
Figure 2. TMem cause precocious differentiation of naive cells.
(A) Representative FACS and (B) bar graph summarizing the distribution of Ly5.1+CD8+ TN-derived cell subsets 6 days following priming with CD3/CD28-specific antibodies and IL-2 alone or with Ly5.2+CD8+ TMem cells. Data shown after gating on Ly5.1+CD8+cells. (C) qPCR analysis of Sell, Ccr7, and Cd27 expression in FACS-sorted reisolated TN cells primed alone, TN cells primed with TMem cells, or TMem cells primed alone. (D) Granzyme B and (E) IFN-γ intracellular staining in TN-derived cells stimulated with PMA/ionomycin following expansion alone or with TMem cells. (F) IFN-γ ELISA of supernatants from reisolated TN-derived cells expanded alone or with TMem cells 6 days prior to overnight stimulation with hgp10025–33 peptide. (G) Heat maps of differentially expressed genes (1-way ANOVA, pFDR < 5%) among TN-derived cells expanded alone or with TMem cells at 18 and 96 hours. (H) RMA-normalized intensity of selected TN-associated genes. (I) Expression of effector cell–associated factors assessed by qPCR at 96 hours from FACS reisolated TN-derived progeny expanded with or without TMem cells or TMem cells expanded alone. (J) In vivo expansion and (K) tumor regression following i.v. adoptive transfer of TN-derived progeny expanded alone or with TMem cells, or TMem cells grown alone in combination with 6 Gy irradiation, i.v. rVV-hgp100, and 3 days of i.p. IL-2. n = 3 independently maintained cultures/condition or time point for experiments shown in B, C, and F–I. K was performed with n = 5 mice per group. All results shown as mean ± SEM. Statistical comparisons performed using an unpaired 2-tailed Student’s t test corrected for multiple comparisons by Bonferroni adjustment. *P < 0.05; **P < 0.01. Data are representative of 16 (A and B), 3 (D and E), and 2 (C, F, and I–K) independent experiments.

