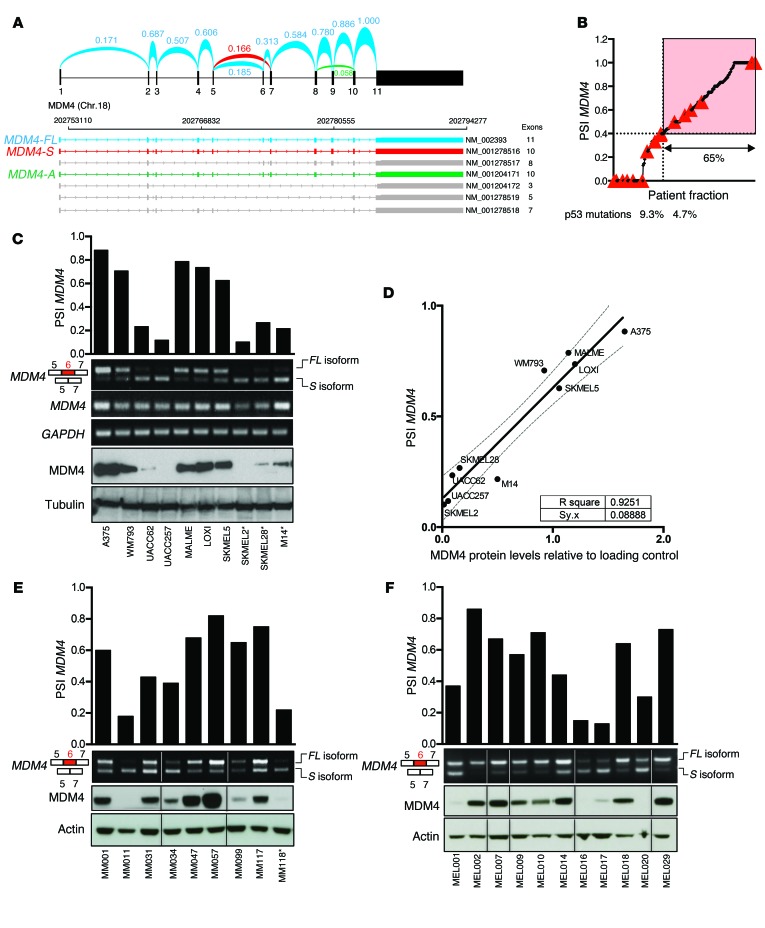
Figure 2. Enhanced exon 6 inclusion leads to MDM4 expression in human melanoma.
(A) Arches represent the relative exon-exon junction usage that was averaged among TCGA-SKCM melanoma samples and inferred from RNA-seq data. Among all previously identified MDM4 isoforms (NCBI’s RefSeq database), MDM4-FL in blue and MDM4-S in red were by far the most abundant. MDM4-A (lacking exon 9, NM_001204171) in green was also detected, but in negligible amounts. The other NCBI-annotated isoforms were not detectable. Chr., chromosome. (B) The PSI index for all TCGA SKCM tumor samples were calculated, sorted, and plotted. A cutoff at the top 65% fraction shows a PSI MDM4 value of 0.4. Red triangles indicate samples with a confirmed p53-inactivating mutation according to Kato et al. (28). (C, E, and F) Semi-quantitative and SYBR Green–based qPCR analyses of total MDM4, MDM4-FL, and MDM4-S isoforms in cultured melanoma cells (C), in a series of short-term melanoma cultures (E), and in melanoma clinical samples (F). GAPDH levels were used as a loading control. Quantification of the PSI index is shown in the top panels. Immunoblot analysis of MDM4 expression levels is shown in the lower panels. Anti-tubulin and anti-actin immunoblotting were used as loading controls. *, denotes TP53-mutant melanoma lesions. (D) Correlation plot between the PSI index and MDM4 protein abundance, normalized to the protein loading control, in melanoma cell lines.

