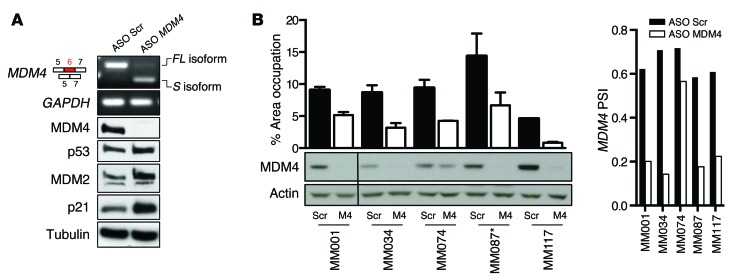
Figure 4. ASO-mediated exon 6 skipping decreases MDM4 protein abundance and melanoma growth in vitro.
(A) Semi-qPCR analysis of total MDM4-FL and MDM4-S isoforms (with GAPDH as a control) in the A375 melanoma cells transfected with MDM4-targeting (ASO MDM4) and scrambled control ASOs. Lower panels show immunoblot analysis of expression levels of MDM4, p53, and the 2 well-established p53 targets MDM2 and p21. Anti-tubulin immunoblotting was used to detect differences in sample loading. (B) Short-term cultures were transfected with MDM4-targeting and scrambled control ASOs, and colony formation was evaluated using low-density colony formation assays 10 days after seeding. For quantification of the colony formation assays, the data represent the mean percentage of area occupancy of 2 biological replicates (mean ± SD). Lower panel shows immunoblot analysis of MDM4 expression levels. Anti-actin immunoblotting was used to detect differences in sample loading. Right panel shows SYBR Green–based qPCR analysis of the PSI MDM4 index after transfection with ASOs. *, TP53-mutant melanoma lesions.

