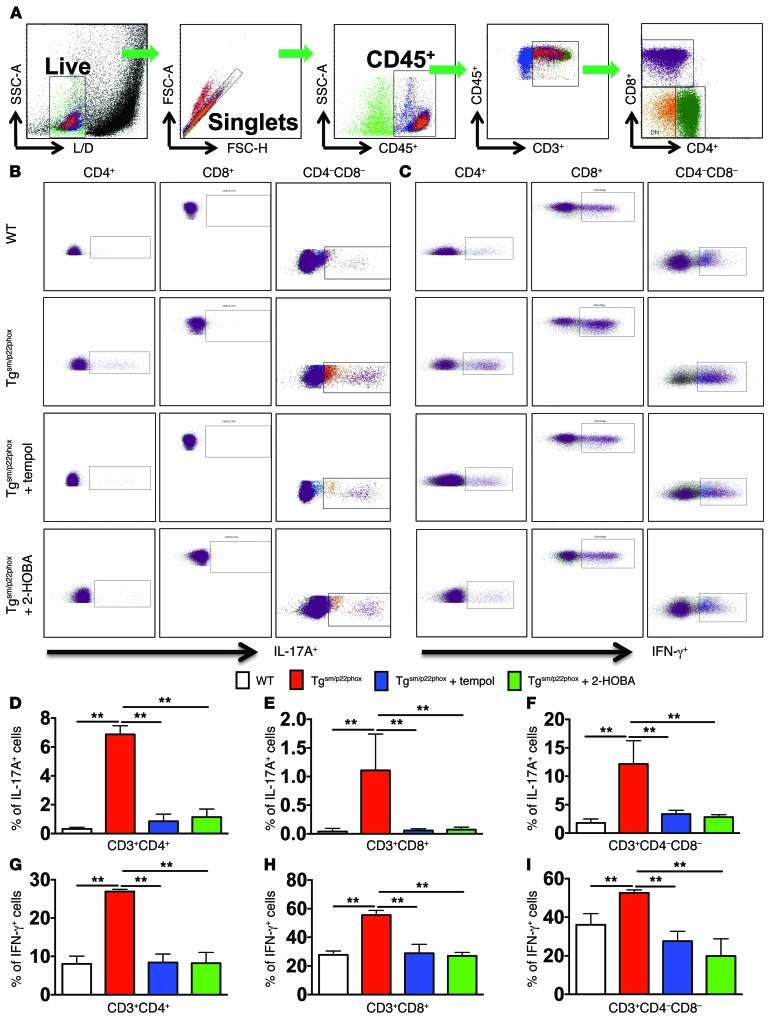
Figure 11. Cytokine production of T cells in the spleen of mice with chronic vascular oxidative stress.
(A) Gating strategy for identifying T cell populations among total spleenocytes. Single cell suspensions were prepared from freshly isolated mouse spleens via enzymatic digestion and mechanical dissociation. (B–I) Intracellular staining indicating IL-17A (B, D–F) and IFN-γ (C, G–I) production in T cell subsets in WT and Tgsm/p22phox mice. Bar graphs were analyzed using 1-way ANOVA (n = 5–7). **P < 0.01.

