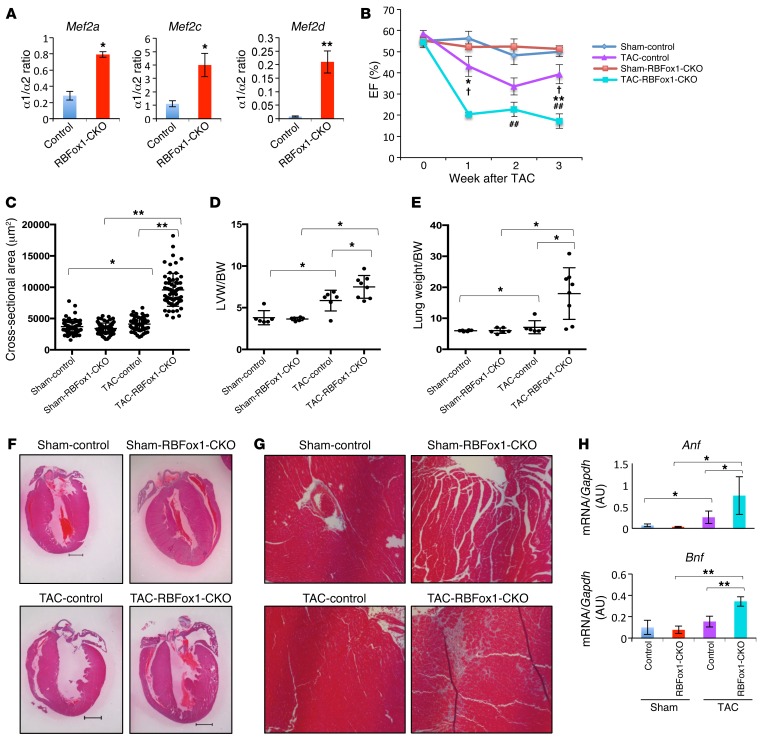
Figure 3. Genetic inactivation of Rbfox1 exacerbates cardiac hypertrophy and HF in mice.
(A) Mef2 α1/α2 transcript ratios in 3-month-old wild-type (Control) and RBFox1-CKO mouse hearts at basal state (n = 3 from each group). *P < 0.05, **P < 0.01. (B) Ejection fraction values of sham- and TAC-operated control and RBFox1-CKO littermates measured by echocardiography (Sham-control, n = 6; Sham-RBFox1-CKO, n = 6; TAC-control, n = 6; TAC-RBFox1-CKO, n = 8). *P < 0.05, **P < 0.01, TAC-control vs. TAC-RBFox1-CKO; †P < 0.05, Sham-RBFox1-CKO vs. TAC-RBFox1-CKO; ##P < 0.05, Sham-control vs. TAC-control. (C) Cross-sectional myofiber area in LVs of sham- and TAC-operated control and RBFox1-CKO hearts 3 weeks after TAC. The values were averaged from 60 slides prepared from 3 hearts in each group. *P < 0.05, **P < 0.01. (D) LV weight (LVW) and body weight (BW) ratios from sham- and TAC-operated control and RBFox1-CKO mice 3 weeks after TAC (control, n = 10; RBFox1-CKO, n = 9). *P < 0.05. (E) Lung weight and body weight ratios among the sham, control, and RBFox1-CKO mice 3 weeks after TAC (control, n = 10; RBFox1-CKO, n = 9). *P < 0.05. (F) Representative cross-sectional images of hematoxylin & eosin staining of LV tissues from control and RBFox1-CKO mice following sham surgery or 3 weeks after TAC. Original magnification, ×2. (G) Representative Masson’s trichrome staining of sham- and TAC-treated control and RBFox1-CKO mouse heart sections. Original magnification, ×20. Data are representative of at least 3 independent experiments. (H) Anf and Bnp expression levels in the sham- and TAC-treated hearts from control and RBFox1-CKO mice as indicated (n = 4 each group). *P < 0.05, **P < 0.01. Significant differences between groups were determined by Student’s t test (A) or multiway ANOVA (B–E and H).

