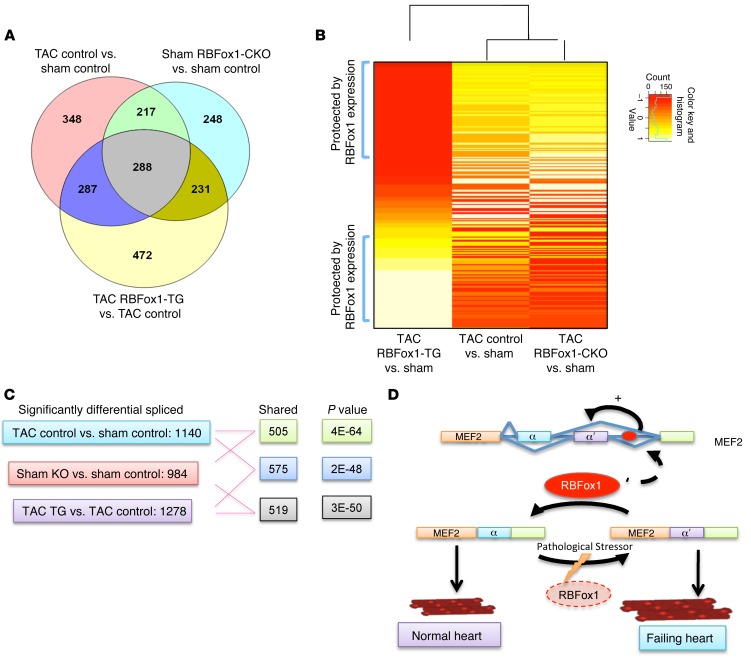
Figure 8. RBFox1 contributes to global RNA splicing reprogramming during HF.
(A) Venn diagram showing differentially spliced exons in hearts identified by RASL-seq (WT sham, n = 5; WT TAC, n = 7; RBFox1-TG TAC, n = 3; RBFox1-CKO sham, n = 3) (RASL-seq was also performed for RBFox1-TG sham and RBFox1-CKO TAC [data not shown]; RBFox1-TG sham, n = 4; RBFox1-CKO TAC, n = 3). (B) Heatmap depicting the 339 differentially spliced exons between TAC- and sham-operated mice identified in all 3 genotypes (WT, RBFox-TG, and RBFox-CKO). Data are row-scaled, and the blue bar in the key is a histogram of the splicing values plotted in the heatmap. (C) Shared splicing events across different samples together with P values. (D) Graphic abstract.

