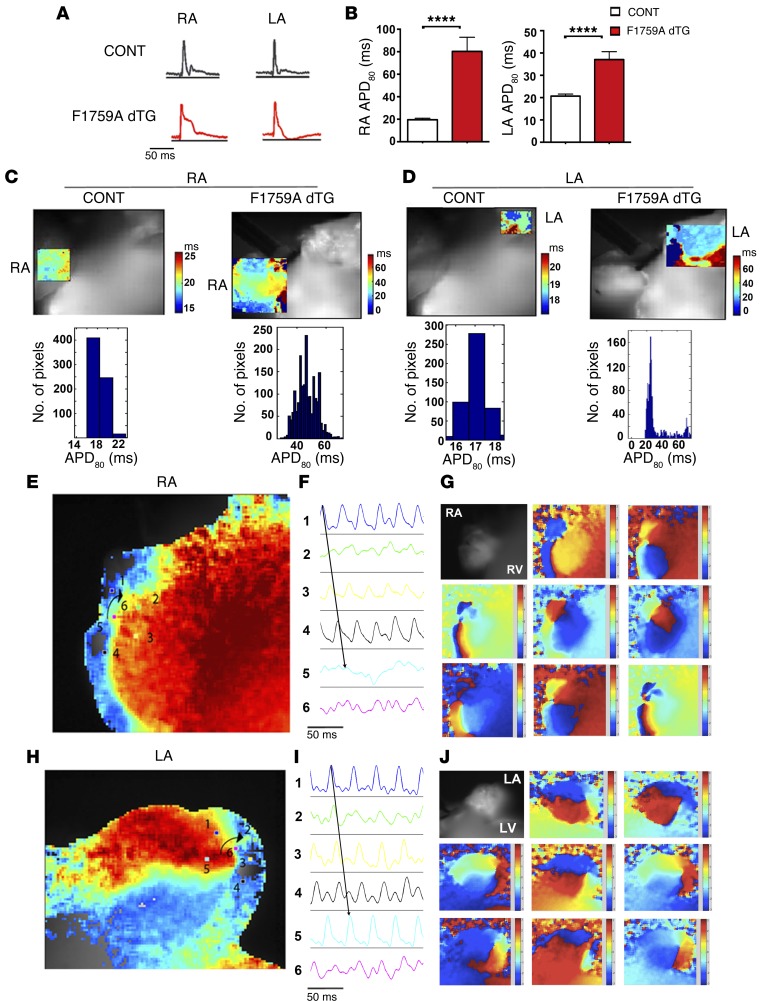
Figure 5. Optically recorded atrial APs and voltage maps of AF.
(A and B) Optically recorded APs from right atrium (RA) and left atrium (LA) of control and F1759A-dTG mice in sinus rhythm (A). Bar graphs showing right and left atrial APD80 of control mice (n = 10 mice) and F1759A-dTG mice (n = 3 mice) (B). Data are presented as mean ± SEM. **** P < 0.0001; t test. The mean atrial rate in sinus rhythm: NTG mice, 338 + 9.5 beats per minute; F1759A-dTG mice, 314 + 9.8 beats per minute. (C and D) Representative APD regional maps and all point histograms of control (CONT) and F1759A-dTG mice showing increased APD80 dispersion in the RA and LA of F1759A-dTG mice. Color legend of APD80 (ms) is shown to the right of each optical map. (E–J) Optical voltage map of AF in Langendorff-perfused F1759A-dTG explanted heart. (E and H) Phase maps of concurrent but independent rotors in the RA and LA. (F and I) Optical APs (electrograms 1–5) around the rotor demonstrate progressive circular reentry around the phase singularity (electrogram 6). (G and J) Progressive phase map of the RA (G) and LA (J) every 10 ms of the phase movie. Red, depolarization; blue, repolarization.

