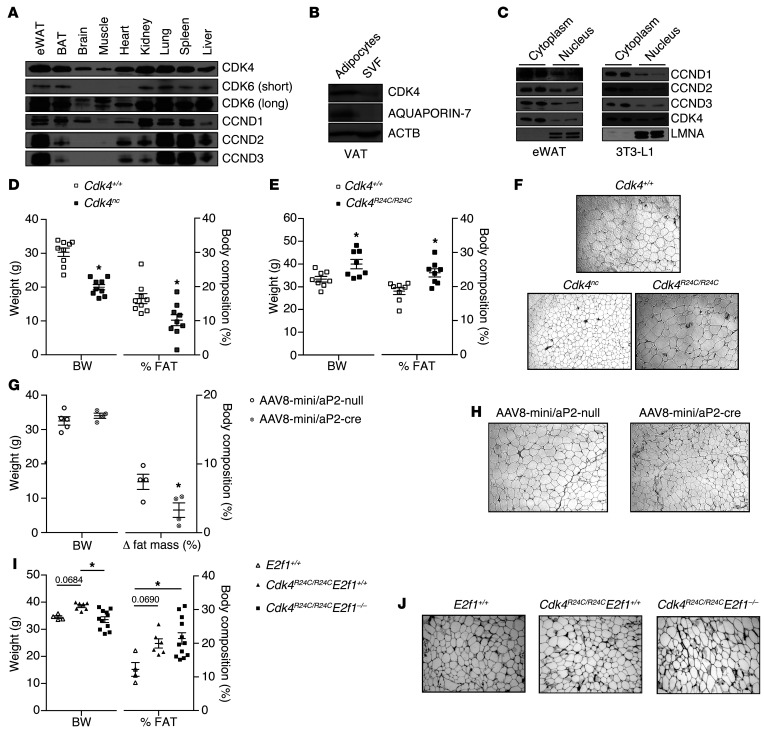
Figure 1. Positive correlation between CDK4 activity and WAT mass.
(A) Expression levels of CCND1, CCND2, CCND3, CDK4, and CDK6 proteins in mouse eWAT, BAT, brain, muscle, heart, kidney, lung, spleen, and liver. Representative blot of several animals analyzed is shown. (B) CDK4 protein level in the SVF and mature adipocytes isolated from VAT. (C) Subcellular localization of CCND1, CCND2, CCND3, and CDK4 proteins in cytoplasm and nuclear fractions of eWAT and mature 3T3-L1 adipocytes. LMNA was used as a control for the nuclear fraction. (B and C) Representative blots out of 3 independent experiments are shown. (D and E) Body weight and percentage of fat mass of 20-week-old Cdk4+/+ and Cdk4nc mice (n = 9) (D) and 30-week-old Cdk4+/+ and Cdk4R24C/R24C mice (n = 8) (E) as obtained using EchoMRI technology. (F) H&E staining of eWAT sections from Cdk4+/+ (23 week old), Cdk4nc (29 week old), and Cdk4R24C/R24C (54 week old) mice. (G) Body weight, Δ to fat mass of 14- to 16-week-old Cdk4flox/flox mice infected with AAV8-mini/aP2-null (n = 5) or AAV8-mini/aP2-cre (n = 4) analyzed by EchoMRI technology (we show the difference between the percentage of fat before and the percentage of fat 3 weeks after infection). (H) H&E staining of eWAT sections from 16-to 18-week-old Cdk4flox/flox mice infected with AAV8-mini/aP2-null or AAV8-mini/aP2-cre. (I) Body weight and percentage of fat mass of 30-week-old E2f1+/+ (n = 4), Cdk4R24C/R24C E2f1+/+ (n = 6), and Cdk4R24C/R24C E2f1–/– mice (n = 12). (J) H&E staining of eWAT sections from 33-week-old E2f1+/+, Cdk4R24C/R24C E2f1+/+, and Cdk4R24C/R24C E2f1–/– mice. Statistically significant differences were determined with unpaired 2-tailed Student’s t tests (D, E, and G) or 1-way ANOVA followed by Tukey’s multiple comparisons test (I). *P < 0.05. Original magnification, ×100.

