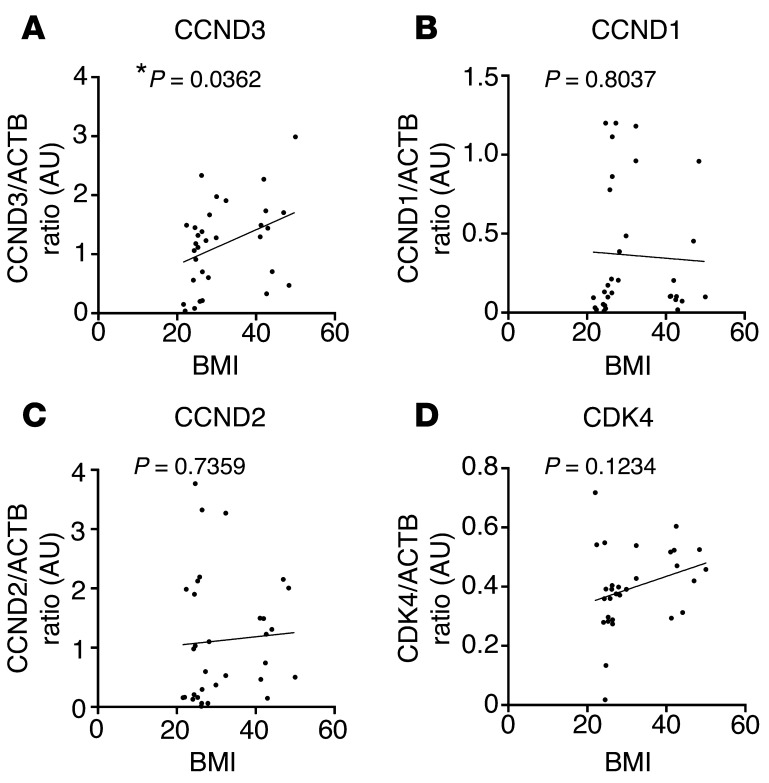
Figure 2. Positive correlation between CCND3 expression and human VAT mass.
(A–D) Correlation between the CCND3/ACTB ratio (n = 32, Pearson’s r = 0.3717, P < 0.05) (A), the CCND1/ACTB ratio (n = 32, Pearson’s r = –0.04574, P < 0.05) (B), the CCND2/ACTB ratio (n = 32, Pearson’s r = 0.06203, P < 0.05) (C), and the CDK4/ACTB ratio (n = 30, Pearson’s r = 0.2875, P < 0.05) (D) and BMI in VAT of human subjects. Data are normalized to ACTB. *P < 0.05.

