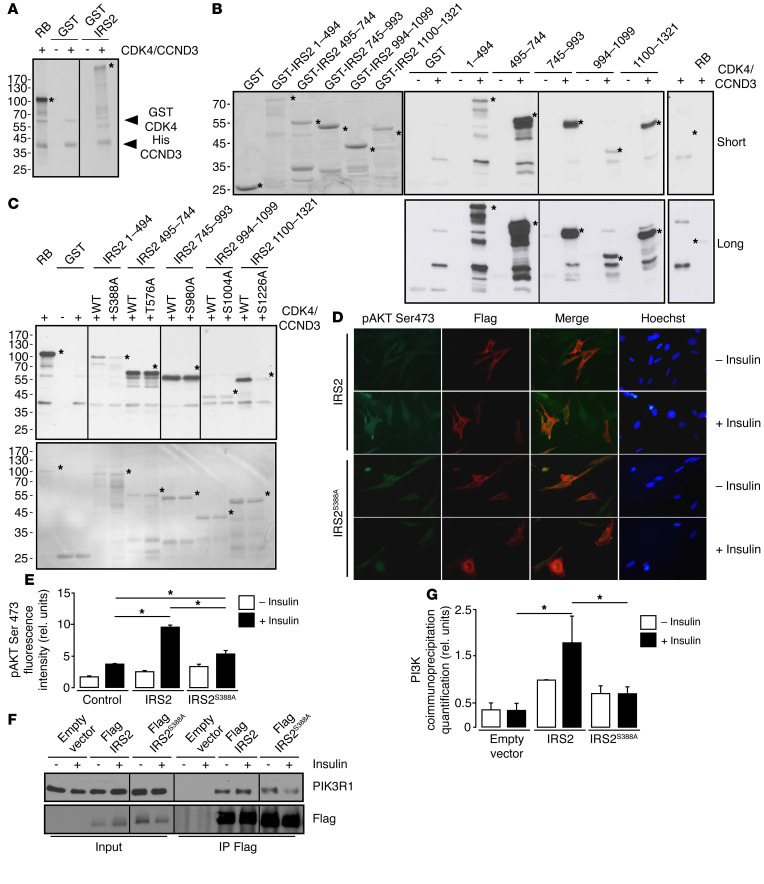
Figure 6. CDK4 phosphorylates IRS2.
(A) CCND3-CDK4 complex directly phosphorylates full-length GST-IRS2 in vitro (n = 3). (B) In vitro phosphorylation of GST-IRS2 fragments (1–494aa, 495–744aa, 745–993aa, 994–1099aa, 1100–1321aa) by CCND3/CDK4. Left panel, SDS-PAGE stained with Coomassie blue for the loading control. Middle panels, autoradiography of the SDS-PAGE gels containing the different GST-IRS2 fragments, incubated with CCND3/CDK4. Right panel, RB1 recombinant protein was used as a positive control (n = 3). (C) Defective IRS2S388A and IRS2S1226A phosphorylation by CCND3-CDK4. Upper panel, autoradiography; lower panel, SDS-PAGE gel stained with Coomassie blue for the loading control. (n = 2). (D) Decrease in pAKT Ser473 phosphorylation in Flag-IRS2S388A electroporated Irs2–/– cells upon insulin stimulation, compared with the WT Flag-IRS2–transfected cells (n = 3). Original magnification, ×400. (E) Quantification of pAKT Ser473 fluorescence intensity for untransfected, Flag-IRS2–transfected, and Flag-IRS IRS2S388A electroporated Irs2–/– preadipocytes was performed with ImageJ software (http://imagej.nih.gov/ij/). At least 100 cells were quantified per condition. (F) Representative Western blot analysis showing impaired interaction between PIK3R1 and Flag-IRS2S388A mutant after insulin stimulation compared with cells transfected with Flag-IRS2 in 293T cells. (G) Quantification of the blot shown in F. A representative Western blot is shown. Data are expressed as mean ± SEM. Statistically significant differences were determined with 2-way ANOVA followed by Tukey’s multiple comparisons test (E–G). *P < 0.05.

