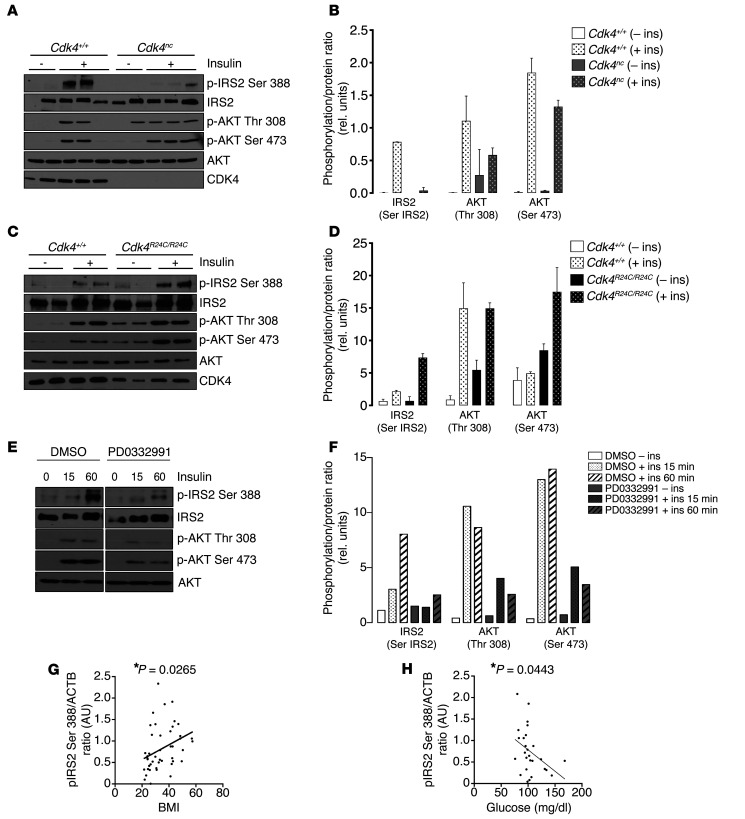
Figure 7. CDK4 phosphorylates in vivo the IRS2 protein at the Ser388.
(A–D) Immunoblot analysis of IRS2 phosphorylation on Ser388 and AKT phosphorylation on Thr308 and Ser473 of 27-week-old control and Cdk4nc mice (n = 2 starved/3 insulin for Cdk4+/+ and n = 2 starved/3 insulin for Cdk4nc) (A). (B) Quantification of the blot showed in A using ImageJ software. Please note that the mouse in lane 5 was not considered for analysis, since this control mouse was not responsive to insulin. CdkR24C/R24C (n = 2 starved/3 insulin for both Cdk4+/+ and CdkR24C/R24C) (40 weeks old). (C) Mice were treated for 50 minutes with insulin. (D) Quantification of the blot shown in C using ImageJ software. (E) Immunoblot analysis of IRS2 phosphorylation on Ser388 and AKT phosphorylation on Thr308 and Ser473 in 3T3-L1 mature adipocytes during a time course insulin stimulation with or without PD0332991 (n = 1). (F) Quantification of the blot shown in E using ImageJ software. (G) Correlation between the pIRS2 Ser388/ACTB ratio in VAT and the BMI of the subjects (n = 45, Pearson’s r = 0.3307, P < 0.05). (H) Correlation between the pIRS2 Ser388/ACTB ratio in VAT and the glycemia of the subjects (n = 27, Pearson’s r = –0.3900, P < 0.05). Data are expressed as mean ± SEM. Statistically significant differences were determined with 2-way ANOVA followed by Tukey’s multiple comparisons test (B–D). *P < 0.05.

