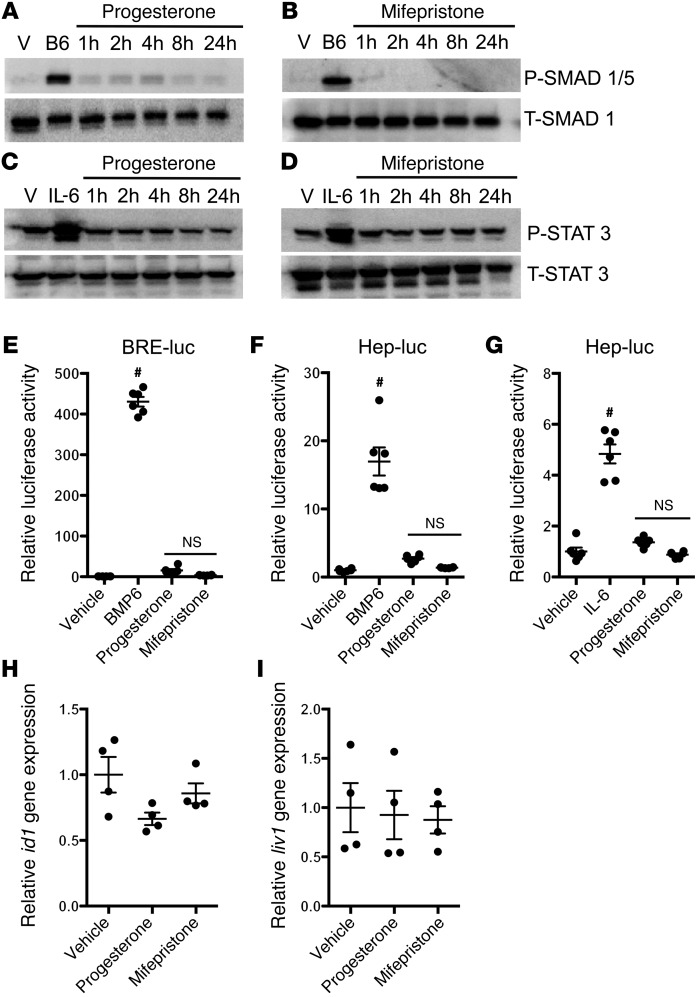
Figure 3. HISs do not activate the BMP or STAT3 signaling pathway.
(A and B) SMAD1/5 phosphorylation (P-SMAD 1/5) and total SMAD1 (T-SMAD 1) levels in HepG2 cells exposed to vehicle (V) or BMP6 (20 ng/ml) for 2 hours and to progesterone (30 μM) or mifepristone (30 μM) for up to 24 hours. (C and D) STAT3 phosphorylation and total STAT3 levels in HepG2 cells exposed to vehicle or IL-6 (100 ng/ml) for 2 hours and to progesterone (30 μM) or mifepristone (30 μM) for up to 24 hours. Representative Western blots from 3 independent experiments are shown in A–D. (E) Treatment of HepG2 cells with BMP6 (20 ng/ml) for 24 hours increased Id1 promoter activity (BRE-luc), while treatment with progesterone (30 μM) or mifepristone (30 μM) had no effect on Id1 promoter activity. (F and G) Treatment of HepG2 cells for 24 hours with (F) BMP6 (20 ng/ml) or (G) IL-6 (100 ng/ml) increased hepcidin promoter activity nearly 15-fold and 5-fold, respectively, as measured by the hepcidin luciferase promoter assay (Hep-luc), while treatment of HepG2 cells with progesterone (30 μM) or mifepristone (30 μM) did not affect hepcidin promoter activity. Results in E–G are expressed as mean ± SEM, #P < 0.001 compared with vehicle treated, ANOVA (n = 6 per group). (H and I) qPCR for id1 and liv1 gene expression in zebrafish. Three-day-old wild-type zebrafish larvae were treated with progesterone (5 μM) or mifepristone (5 μM) for 12 hours and then lysed prior to qPCR analysis. Results are expressed as mean ± SEM (n = 4 per group).

