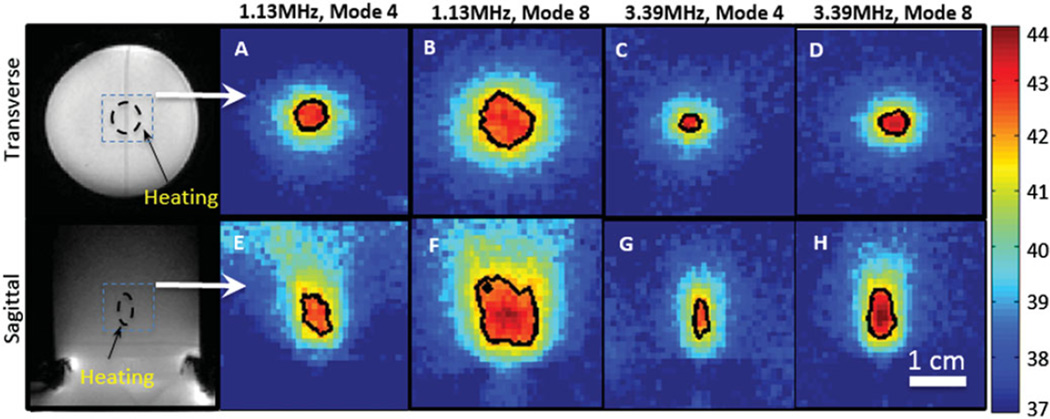
Figure 4.
Spatial heating patterns produced in a tissue-mimicking phantom using different combinations of frequencies and lenses. The black contour in each panel indicates the 42 °C isotherm. The temperature distributions transverse (A–D) and along (E–H) the ultrasound beam axis are shown. The location of heating in the phantom is shown in the magnitude images.

