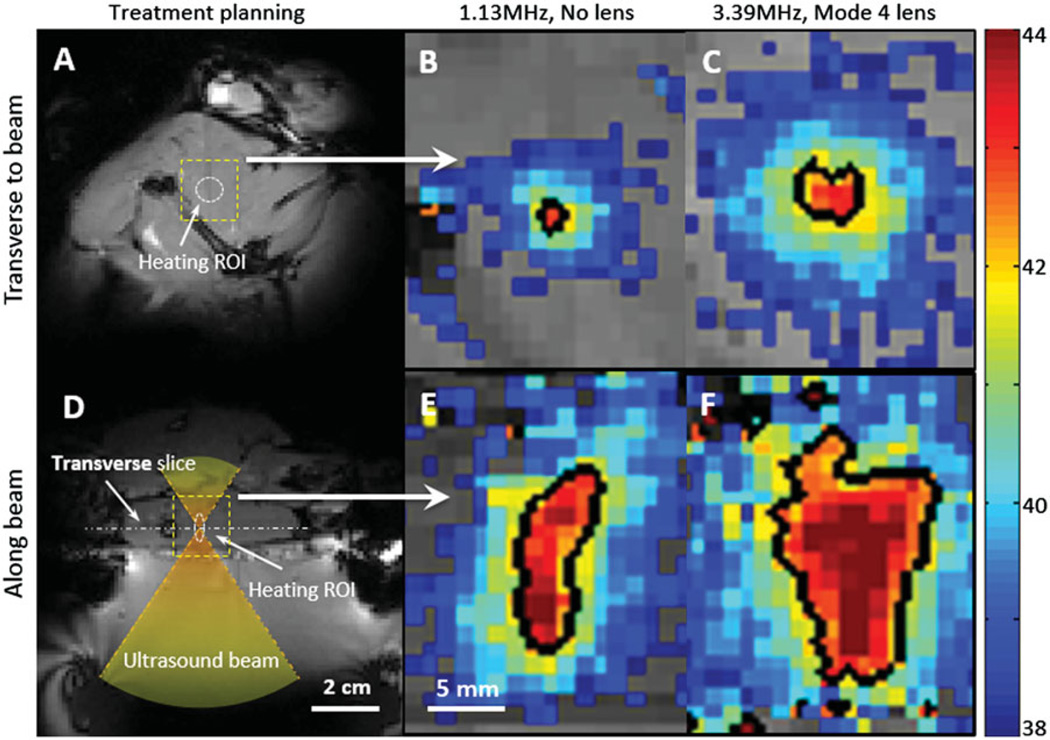
Figure 5.
Zoomed-in spatial heating patterns(within the dotted boxes in A, D) measured in a rat thigh with a bare transducer operating at 1.13 MHz (B, E) or a mode 4 lens operating at 3.39 MHz (C, F). The temperature maps were acquired at 10 min after sonication. The top panels show the heating transverse to the beam in the focal plane, and the bottom panels show the heating along the beam. Panels A and D depict the process of treatment planning and the location of heating ROI. The black contour indicates the 42 °C isotherm.

