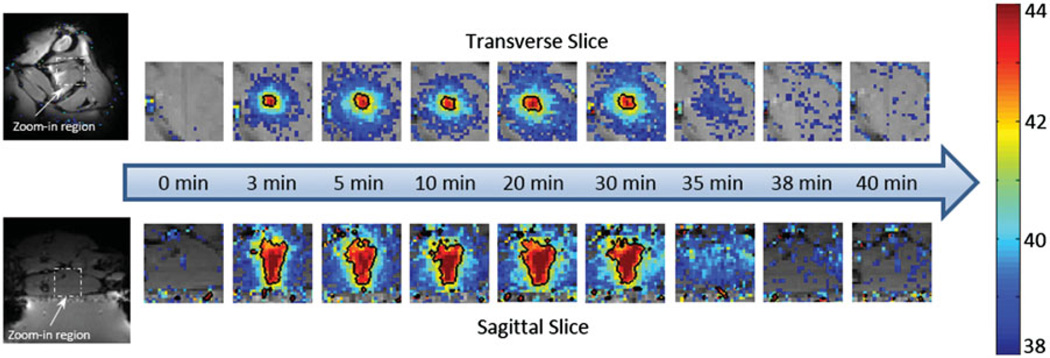
Figure 6.
The temperature maps acquired at different time points during the in vivo experiment. Nine time points were selected to represent pre-treatment, during treatment and post-treatment, separately. The black contour showed the 42 °C isotherm. Uniform heating pattern was observed during the treatment. Post-treatment maps indicated that no undesired heating was created within the surrounding tissue.

