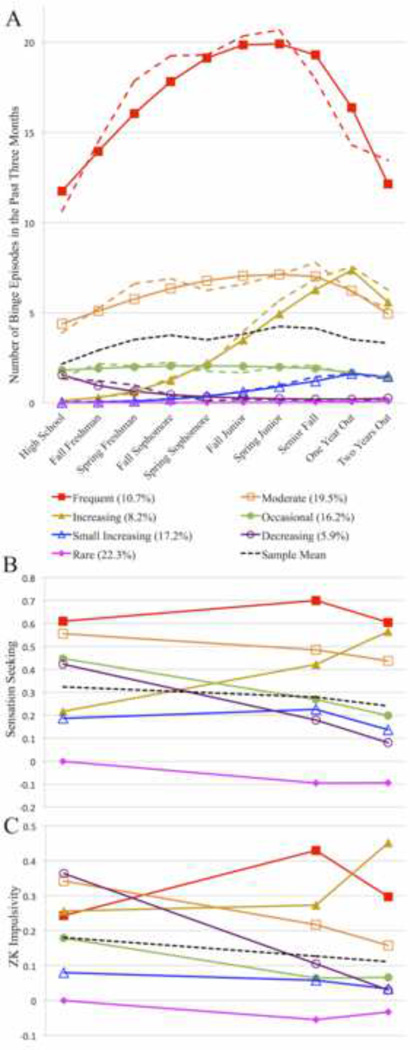
Figure 2. Binge Drinking Trajectories and Personality Change.
A) Solid lines are model-implied values, and the dotted lines trace observed values for the seven binge drinking classes. The fine-dotted black line shows whole sample means across time. Personality trait measures (represented as latent class factor means, shown in Figure 3) had different maturation patterns by class for B) Sensation Seeking and C) ZK Impulsivity. The mean of the Rare class at Wave 1 (High School) was constrained to be zero in order to identify the model.

